




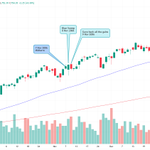

$NVDA - Monday's option data shows positive bias with bullish conviction in p/c ratio

members can search given ticker for option analytics at
optionedge.ai/ticker-researc…
Everyone's scared of a November crash.
Here's what the data actually shows since 1960:
S&P 500 dropped >5% in November just 5 times in 67 years.
1973 — 11.4% ↓ (Oil crisis)
1974 — 5.3% ↓ (Midterm year ★)
1987 — 8.5% ↓ (Black Monday aftermath)
2000 — 8.0% ↓ (Dot-com unraveling)
2008 — 7.5% ↓ (GFC freefall)
Avg crash: -8.2%
Frequency: 1 in every 13 years, that too mid-term year correction in november is very rare.
The fear is priced in every year.
The serious correction shows up once a decade.
November isn't dangerous, but panic-selling in November is.

For those who doubt my market projections, take a look at some of my previous posts.
Go back and compare my calls with what actually happened in the market. You’ll see just how closely I’ve been calling market direction.
The track record speaks for itself.

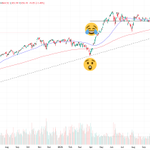
$SPY - Twenty years ago, when I was trading through November 2006, the climate was identical to what we're seeing today under George W. Bush, when it felt like everything was going wrong.
The midterm elections were on November 7, 2006, as a blue wave swept across Congress (just like in 2026).
On November 8, the market initially dipped before buyers stepped in. But by November 9, the market gave back all of those gains in a classic post-election shakeout. Only after that head-fake did the secular uptrend resume.
Beware of the initial euphoria—don't get swept up in the immediate headline reaction.

Sunday’s WeeklyEdge is out for members!
This isn’t your typical market newsletter. Every edition is packed with actionable market insights, technical analysis of $SPY, $QQQ, $IWM, $GLD and $TLT, plus a featured trade idea.
This week, we’re spotlighting a big tech name we believe could recover faster than the broader market.
More than just market commentary — WeeklyEdge is designed to help you stay ahead of the market.

Anyone else notice Trump has been unusually quiet on social media over the past two days?
What's behind the silence?
$SPY unless the price close above 741, be cautious on long side.
741 is GEX flip and if it breakout 741, then next stop is 750
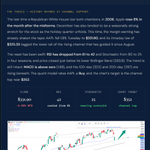
$NVDA - Based on our quant analysis , NVDA is one of the top 10 stocks that would recover much faster when market recovers.
optionGeek ✨ retweeted

404 stocks declining in $SPY while 61.7% still sit above their 50-day moving average is one of the most dangerous breadth divergences an options trader can face — and most people are positioned completely wrong for it. That gap tells you the selloff is narrow and fast, likely a rotation or sector flush rather than a systemic unwind, which means IV (Implied Volatility) is probably being bid up on names that will snap back hard and punish premium buyers. The smart play here is not chasing puts on beaten-down names with elevated IV — it is selling OTM (Out Of The Money) puts on high-quality stocks still holding their 50-day MA, where you are getting paid for fear that the technicals do not yet justify. The divergence also warns against naked directional bets: when internals are this split, the index can chop violently while individual names move in opposite directions, which destroys straddle and strangle buyers who need a clean trending move to profit. Watch whether that 61.7% above-50-day-MA number starts rolling over in the next few sessions — if it breaks below 55%, the selloff is broadening and your thesis shifts entirely toward defined-risk bearish structures. Screen for names with IV Rank spiking above 60 that are still technically intact using the IV Crush Screener, and you will find the cleaner premium-selling setups hiding inside this messy tape.

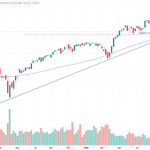
$SPY – On the weekly chart, the 50-week MA sits around 723, which also lines up with a key trendline connecting previous market selloffs, including the April 2025 Liberation Day decline.
I'm not saying $SPY will necessarily fall that far, but if it does, I'd view that level as a potential opportunity to go long rather than panic.


$SPY The AI fear is overblown following the Blue sweep.
The majority of Democratic donors come from Big Tech and Wall Street.
Why would the new Congress sabotage AI investments when it would hurt the party in the 2028 election?
In my opinion, this dip is a great buying opportunity