

Investor, swing trader, and deep research. My opinion, not financial advice.
Romania
Joined June 2026
- Tweets15.3K
- Following1.2K
- Followers2.1K
- Likes42K



Pinned Tweet
🚨 MARKET STRENGTH RADAR | OCTOBER 27, 2026
📈 GROWTH RECOVERS. MARKET BREADTH IMPROVES. BUT CLEAN STOCK LEADERSHIP IS STILL NARROW! 👀
The latest Market Strength Radar update shows an important shift.
Growth regained structural strength. More sectors improved over the intermediate horizon. Semiconductors started repairing.
But the cleaner stock leadership pool actually contracted.
This is improving market participation, not a confirmed broad recovery.
📊 WHAT CHANGED?
🟢 $QQQ vs $SPY RS126D: +0.19% → +1.42%
🟢 Positive RS63D sectors: 15 → 21
🟢 Positive RS126D sectors: 18 → 20
🟢 Semiconductors recovered positive intermediate and structural relative strength.
🔴 Fully aligned sectors: 14, unchanged
🔴 Combined stock leadership candidates: 91 → 90
The market improved beneath the surface, but the strongest stock screening pool did not expand.
📈 THE MACRO PICTURE
Growth through $QQQ is recovering against $SPY.
🟢 RS126D: +1.42%
🟢 RS252D: +2.80%
🔴 RS21D: -2.62%
The longer structure improved, but short window confirmation remains incomplete.
Small caps are still behind.
🔴 $IWM vs $SPY RS126D: -5.57%
🟢 $IWM vs $QQQ RS21D: +2.15%
🔴 $IWM vs $QQQ RS63D: -11.56%
Small caps are outperforming growth over the short window, but remain structurally weak.
Rotation is visible. Full confirmation is not.
🛡️ WHERE IS THE STRENGTH?
The leading sectors remain concentrated.
🟢 Cloud: $WCLD +45.15% RS126D
🟢 Cybersecurity: $CIBR +41.21%
🟢 Software: $IGV +19.56%
🟢 Healthcare: $XLV +14.14%
🟢 Energy: $XLE +8.89%
Genomics through $ARKG remains structurally strong at +47.91% RS126D, but its RS21D is still -3.77%.
Strong longer term leadership does not always mean strong current momentum.
⚠️ THE SEMICONDUCTOR TWIST
$SOXX showed meaningful recovery.
🟢 RS126D: +0.91% → +7.43%
🟢 RS63D: -3.18% → +4.08%
🔴 RS21D: -9.81%
$SMH and $XSD also improved structurally.
But short window weakness remains.
Semiconductors are repairing, not yet showing clean leadership.
🎯 NOW LOOK AT THE STOCK FUNNEL!
The radar tracks 1,318 stocks.
🟢 58 Conditional Front Line candidates
🟡 32 Developing Leadership candidates
🔵 90 Combined Leadership Candidates
🔴 0 Fully Confirmed Front Line
Only 6.8% of the tracked universe sits in the two strongest screening layers.
And 55 of those 90 candidates are concentrated in just four groups:
$IGV, $CIBR, $XLK and $XLV.
Better sector participation is not automatically creating more clean stock setups.
⚠️ THE DATA WARNING
Three of four core market relationships and 51 of 54 sector rows match October 27.
The $RSP versus $SPY relationship and three sector rows remain one session behind. The driver layer is not fully synchronized.
That limits how much confirmation I can claim.
🔎 SO WHAT COMES NEXT?
Can the improving sector breadth turn into a larger pool of genuinely stronger stock candidates?
Or will the recovery remain concentrated in a handful of sectors?
MY CURRENT READ:
Growth is improving. Intermediate breadth is expanding. Cloud and cybersecurity remain strong. Semiconductors are repairing.
But the market still lacks broad structural confirmation, and the cleaner stock opportunity set remains narrow.
Selective leadership with improving participation. Not a confirmed broad market recovery.
The next step is manual chart validation. Support, resistance, price location, liquidity and failure levels still matter.
Deep dive & support the radar: buymeacoffee.com/tapevector
My market journal, not financial advice.
The dashboard tells me where to look, not what to buy.
Price first. Relative strength second. Theme confirmation last.
🤖 Made with AI


TAPE Vector retweeted

$UBER CEO bought $10M of stock at $71
Today, you can buy below him at $65
• Massive open-market insider purchase
• Shares ~8% below CEO’s buy price
• Earnings coming November 4th
Hmm… 👀


TAPE Vector retweeted

$RKLB (weekly) - Somewhat of a messy GEX map, with a negative node at $60 and our support node at $55.
Breaking that $60 node accelerates the move up to $62, while the loss of $55 opens the route to $50.
All in all, the GEX map for this week remains kind of messy, and I'm not seeing a play here just yet. Unless we touch down on that $55 or $50 node and see it holding there, that could set up the play, but time will tell if we get that this week.
What I do like is how the VEX map is lining up for January:
$80 1/15 VEX
$85 1/21 VEX
$90 1/15 VEX
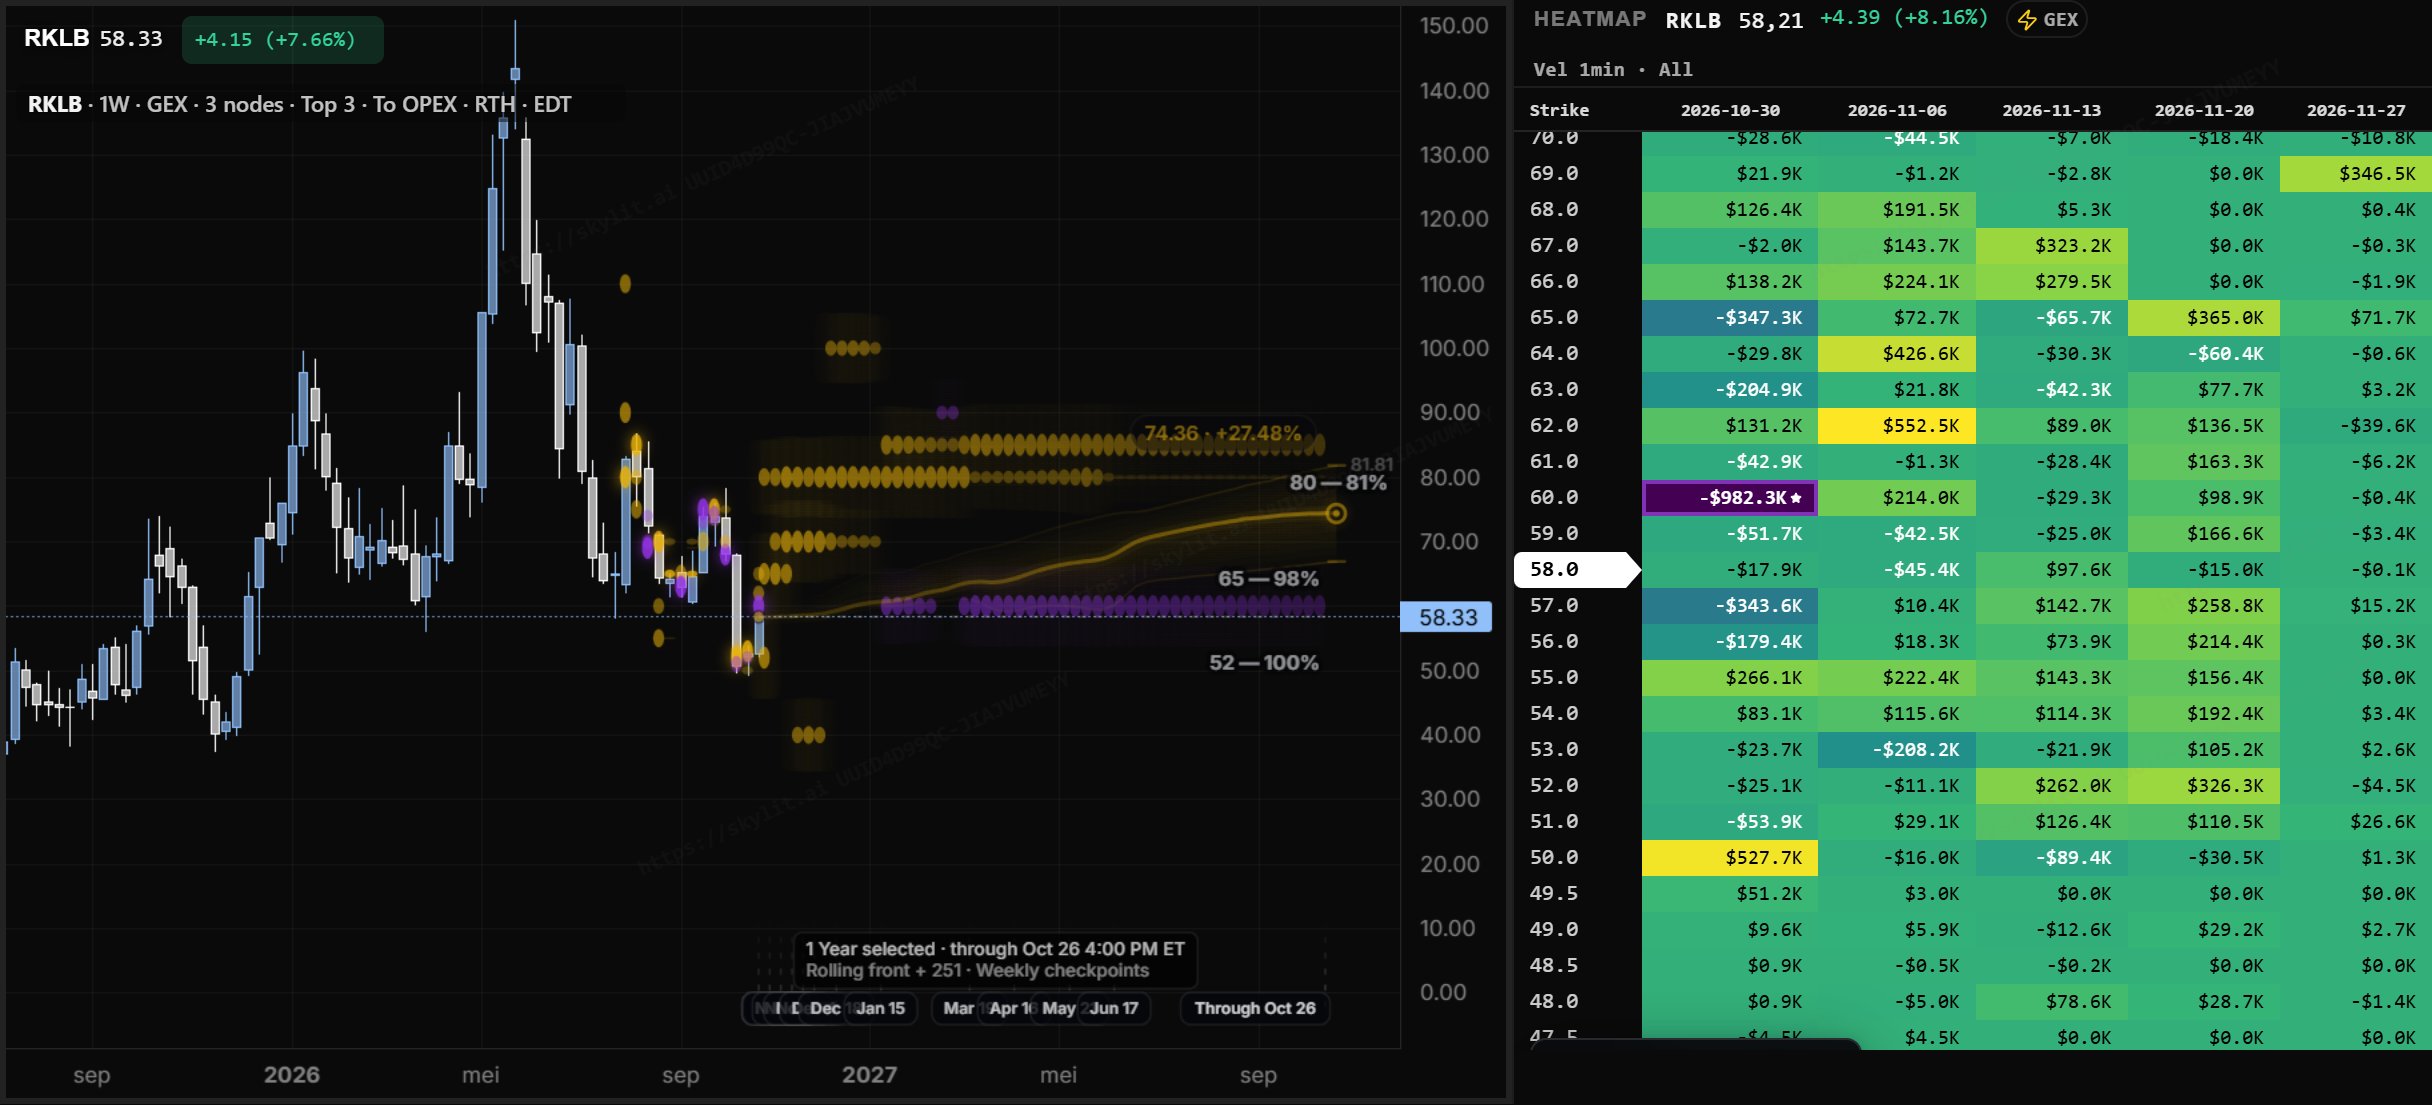

$RKLB (weekly) - Just like its counterpart $ASTS, this has had a brutal drop, but it’s also arriving at a spot that really has my interest, as I think this is where we have a very good shot at finding our bottom on this name.
Price action will always lead us there, but just like $ASTS, it’s my thesis that Space will make another leg here, and I’m going to be here for that ride.


TAPE Vector retweeted
Cathie Wood bought OVER $32 MILLION worth of $CBRS at ~$310 back in May! 😭
Today, shares trade BELOW $110! 💀
She’s been aggressively buying the dip and adding to her position ever since.
• Down ~65% from her initial purchase price
• Shares have plunged over 45% in the past month alone
Yet she STILL keeps buying.
Absolutely brutal…


TAPE Vector retweeted

🦇Batman Commentary
After unanimously raising rates in September, the Fed shifted to a hold by majority vote in October. In my view, this is a pause to assess incoming data while maintaining a hawkish bias. The description of economic growth changed from “solid pace” to “strong pace,” signaling a stronger assessment of economic activity. The inflation language is unchanged. Compared with the previous press release, the focus has shifted from justifying a hike to awaiting more data. Lisa Cook and Beth Hammack wanted a 25 basis point hike at this meeting. The employment language is unchanged.
If the economy remains strong, there is less need to cut rates to support growth, while the Fed retains room to raise rates again if necessary.
On inflation, September’s message was that the hike would help bring inflation back to target. In October, the message is that more information is needed to determine the appropriate policy stance.
In short: the policy action is less hawkish than in September, the growth language is more hawkish, and the commitment to the inflation target is unchanged. I do not see a message preparing the market for rate cuts, but there is also no guidance confirming that another hike is imminent.


TAPE Vector retweeted

I don’t think the BoC hike makes sense based on their own report. They are worried businesses will start raising prices to make up for the higher costs they have absorbed so far. But their own report says that hasn’t really happened yet.
So how does a hike stop that? It makes it harder for businesses to sell and that doesn’t fix their costs. It just leaves them stuck with those costs while their borrowing costs go up. Most businesses will likely deal with that by cutting hiring.
The BoC thinks this hike is small enough that it won’t slow growth much. But we have had a growth issue in Canada since 2015 and businesses and workers are already weak.
They are hiking on where they think inflation is going. But their own report says the trade war could make businesses hold off on hiring and expanding.

🇨🇦BoC has hiked for the first time since 2023. I don’t think this is the right move. They seem to want to get ahead of any pass through that could happen since this supply shock is continuing longer than most thought.
It is strange to me because Canada’s core inflation is still low. CPI trim and CPI median actually fell in September to 1.8% and 1.9%. Even the BoC said the case for holding was that the rise in inflation is mostly energy and core is still close to 2%.
The suits at Desjardins say the BoC has to act on where inflation is heading and not where it’s been. But that depends on how much of this oil shock gets passed through. The BoC was late to hike in 2022. But CPI trim was 4% when they started hiking and now it’s 1.8%.
Businesses saying they plan to raise prices doesn’t mean consumers can afford to pay them. Wages are up 2.3% while prices are up 3.1%.
A hike doesn’t fix the oil supply problem. It makes borrowing more expensive while households are already paying more for energy. Canada is only expected to grow 1% this year and lost 110K jobs in August and September. Unemployment is at 6.5%.
Most of this year’s growth came before trade talks broke down. Growth is expected to slow to a 0.8% annual pace from October to December as the new tariffs hit. The BoC’s rebound next year counts on exports and business investment picking up while the trade war is still on.
So why can the US consider hiking? Their inflation is at 3.7%, growth is expected at a 2.3% annual pace from October to December, they added 162K jobs in August and September and unemployment is at 4.2%. The US has more of an inflation problem than a growth problem. Canada has the opposite.
The BoC is acting on where inflation is heading. But what about growth and jobs? I will continue to dig into this.


TAPE Vector retweeted

The Federal Reserve voted 10-2 to MAINTAIN federal funds rates at 3.75%-4%, After raising 25bps in September.
The next FOMC meeting is December 9th, 2026

TAPE Vector retweeted

GUYS TWO MORE.
I GOTTA SET A QUEUE.
TWO MORE OF MY FAVORITE ACCOUNTS JUST JOINED THE SHOW.
@TechniCameron
@legendtrades45
GO FOLLOW BOTH NOW! 💪🔥

TAPE Vector retweeted
I know Kevin Warsh be thinking about this meme often.
So no funny business today ok Mr. Warsh…?

TAPE Vector retweeted

Trade finance just hit the XRP Ledger.
This is about the fresh Ripple Swell partnerships:
BNY — Institutional custody for XRP + RLUSD, plus exploring tokenized trade finance on XRPL
C2FO — Instant Pay settlement on XRPL using RLUSD (suppliers get paid in seconds instead of days)
Robinhood — RLUSD for retail/institutional use + XRPL settlement
Major TradFi and fintech rails moving onto the ledger. Green means go.
#XRP #XRPL #RLUSD #TradeFinance
xitter.cf/XRP/status/21152363552…


Three interesting developments from Loomie this morning. $ON, $GOOGL and $HOOD. Three different businesses, but all connected to how technology infrastructure is evolving.
I was going through my latest Loom briefings this morning, and these three stories caught my attention.
What I find interesting is not simply which stocks might benefit from the news. It is what these developments tell us about where companies are investing, which technologies are becoming more important and how the competitive landscape is changing.
And once again, this is not a paid promotion. Loom and Loomie are simply tools I use in my daily research.
1. $ON Onsemi is reportedly discussing a $1B acquisition of Ferric.
This is an interesting development in semiconductor power management.
According to The Information, Onsemi is in discussions to acquire Ferric, a company developing integrated voltage regulators for advanced processors.
Why does this matter?
We spend so much time discussing how powerful AI processors are becoming, but there is another problem that becomes increasingly difficult as computing performance improves.
How do you deliver enormous amounts of electrical power directly to a processor without wasting too much energy or generating excessive heat?
Traditional power management systems rely on components positioned around the processor.
Ferric develops technology that integrates power regulation much closer to the chip, using specialized magnetic materials and integrated inductors.
That can reduce the space required for power delivery, improve efficiency and help processors respond faster to changing electrical demands.
For AI infrastructure, this is important because computing density and power consumption are becoming major engineering constraints.
And Onsemi is not the only company pursuing this opportunity.
In May, $ADI announced a $1.5B acquisition of Empower Semiconductor, another company developing advanced integrated power delivery technology. That acquisition was completed in July.
Two major semiconductor companies targeting similar technologies suggest that power delivery is becoming strategically more important.
But there is an important distinction.
The Onsemi transaction is still being discussed. No definitive agreement has been announced, and we do not have sufficient financial information to determine whether the proposed valuation makes sense.
I like the strategic direction. I still want evidence of commercial adoption and profitable execution.
2. $GOOGL OpenAI reportedly plans to purchase Google's AI chips.
This could become a meaningful development for the AI semiconductor market.
According to reporting from The Information, Reuters and Bloomberg, OpenAI intends to purchase Google's Tensor Processing Units, or TPUs.
No confirmed contract value, volume or delivery schedule has been disclosed.
But the implications are interesting.
For years, $NVDA has dominated the AI computing market through its GPUs, software ecosystem and networking infrastructure.
Google has been developing its own specialized processors for more than a decade, initially to support internal workloads.
Now those chips are becoming increasingly relevant outside Google's own infrastructure.
And there is already stronger evidence of that transition.
On October 27, Google and $ORCL officially announced that Google TPUs will become available through Oracle Cloud Infrastructure beginning in 2027.
That is a confirmed commercial distribution agreement, not just a reported negotiation.
The important distinction is that companies building AI models increasingly want more than one computing architecture available.
They want to compare performance, energy efficiency, availability and the cost of running their models.
That doesn't mean NVIDIA's dominance disappears.
Different processors can be better suited to different workloads, and the demand for computing capacity is large enough for multiple architectures to coexist.
But it does suggest that Google's custom silicon is becoming a more serious commercial product.
For $GOOGL, the opportunity is potentially larger than using TPUs internally. It could become a growing external infrastructure business.
What remains unproven is the size, profitability and sustainability of that business.
I want to see actual contracts, deployments, customer adoption and financial contribution before assigning significant additional value to the thesis.
3. $HOOD Robinhood and Ripple announce a strategic stablecoin partnership.
This one is especially interesting after Robinhood's latest earnings report.
On October 27, Ripple and Robinhood announced a partnership involving RLUSD, institutional settlement, treasury management and digital asset financing.
RLUSD is already available through Bitstamp by Robinhood and Robinhood Chain, with availability in the main Robinhood application expected later in 2026.
But this partnership goes further than simply adding another digital asset to a trading platform.
Robinhood plans to use Ripple's infrastructure for institutional settlement, while Ripple Treasury will support activities such as cash management, liquidity management, payments and financial operations.
Ripple Prime also provides institutional lending and trading services connected to Bitstamp.
This is an example of blockchain infrastructure moving beyond speculative trading and into financial operations.
And that matters for Robinhood's long term strategy.
The company is trying to expand beyond the traditional retail brokerage model into a broader financial ecosystem.
Banking, institutional services, asset management, digital assets and payment infrastructure can all become parts of that business.
But again, I want to separate commercial announcements from actual financial results.
Robinhood's cryptocurrency transaction revenue declined significantly in Q3, even while other business lines continued growing.
A new stablecoin partnership doesn't automatically solve that problem.
What I want to see is adoption, transaction activity, institutional usage and measurable revenue contribution.
The partnership is real. The financial impact still needs to be demonstrated.
Now, why am I putting these three developments together?
Because they illustrate different layers of the same broader transformation.
$ON is looking at technology that improves how electrical power reaches advanced processors.
$GOOGL is expanding the potential market for specialized AI computing hardware.
$HOOD is developing financial infrastructure that could support a broader range of digital and institutional transactions.
Different companies. Different industries. Different opportunities.
But they also share something important.
The market is moving beyond the first stage of building new technology and increasingly focusing on the infrastructure needed to make it efficient, scalable and commercially useful.
That is where I believe investors should be paying attention.
Not every company exposed to these developments will become a winner.
And a strong industry theme doesn't automatically make an individual stock attractive at its current valuation or chart location.
Now, a few words about Loomie itself.
This is exactly why I continue using the app.
It brings developments like these into one place, identifies the companies involved, presents possible tailwinds and headwinds, and highlights what deserves further investigation.
Instead of spending my morning jumping between several financial news websites, I can quickly identify interesting developments and decide which ones deserve a deeper look.
Then I go to the original reporting, company announcements, financial statements and charts to validate the information.
I don't blindly trust every AI interpretation, and I don't treat a positive sentiment classification as a buy signal.
For example, the $ON acquisition is still a report about negotiations, while the Robinhood partnership is officially announced. Those are very different levels of evidence.
Loomie helps me discover the story. My research determines how much of that story I can trust.
And that is what makes it useful to me.
Credit again to @IAMSubhransu7 for building the platform and continuing to develop it.
If you are an investor or trader who follows multiple sectors and wants a more organized way to monitor important developments, I think it is worth exploring.
loomfinance.ai/
Not a paid partnership. Just another look into the tools and information I use in my daily market research.
The news gives me something to investigate. The evidence tells me what is real. The chart determines whether there is an opportunity.
My market journal, not financial advice.


$VRT +18% from my $207 entry, and I have to give credit where it's due. Thank you, @HunterAllen4 !
A while ago, following the guidance shared by my friend Allen, THE GAP FATHER, in his Telegram channel, I added $VRT at approximately $207.
whop.com/gap-father-swings/?…
And today, October 28, Vertiv reported excellent earnings, sending the stock toward $244 in premarket trading.
I have to admit, watching that move feels pretty good!
The earnings numbers explain why the market is reacting.
Revenue reached $4.31B, growing 61% year over year, with organic growth of 55%. Adjusted EPS increased 78% to $2.21, while adjusted operating margin expanded to 25.2%.
But what really caught my attention was organic orders growing more than 100%, alongside management raising its full year revenue guidance by $650M at the midpoint.
That is significant demand for the power, cooling and infrastructure systems needed to build and operate data centers.
And it gives the long term business thesis more support.
Now, back to the trade.
My entry was around $207, and the stock is trading near $244 before the open. That is approximately 18% upside.
And here is the funny part.
If I sold just one share at this price, the profit from that single share would cover more than half a year of my Gap Father Swing Channel membership!
Yes, one share!
And I am still a little frustrated with myself because $VRT offered another opportunity below $200, but I simply didn't have the available liquidity to add.
Sometimes the chart gives you another chance, but your cash balance has other ideas!
I am not complaining though. I have a position, I like the business, and the earnings have strengthened the fundamental case.
Am I selling now? Not at this point.
My intention is to continue holding and see whether this recovery can eventually develop into a move toward the previous highs.
But I am not treating that as a guarantee.
After such a strong premarket move, the stock still needs to prove that buyers can sustain the recovery during regular trading.
There is also overhead resistance to work through, so I am not interested in chasing this move with a full size addition.
And this brings me back to @HunterAllen4 .
This is one of the reasons I appreciate his work.
He doesn't just throw tickers around. He shares his market observations, trading ideas and technical reasoning, giving people something they can study and evaluate for themselves.
I still make my own decisions. I still study the charts, manage my entries and take responsibility for my trades.
But having another experienced trader whose work I respect is genuinely valuable.
And in this case, his guidance helped me identify an opportunity that is developing very nicely.
If you want to explore his work, this is the channel I personally subscribe to:
whop.com/gap-father-swings/?…
Full disclosure: this is my affiliate link, and I earn a 40% commission on subscription payments, including renewals, when someone joins through it.
Thank you, brother @HunterAllen4. Great guidance, and a very nice trade so far!
Now I want $VRT to prove the next phase. The earnings were excellent, but the price still has work to do before we can start talking seriously about a return to the previous highs.
And remember, one successful trade doesn't guarantee the next one will work.
My trading journal, not financial advice


$VRT
You smell that rip salad? 🥗
The AI chip trade is crowded, obvious and heavily owned.
The less obvious opportunity is what sits beneath it: the power, generation, cooling, transmission and construction bottlenecks required to keep AI data centers running.
Everyone knows $NVDA. More people are starting to understand $VRT, $ETN, $GEV and $PWR. The bigger opportunity is understanding what happens underneath them as AI infrastructure scales.
U.S. electricity demand is projected to hit record levels of 4,270 TWh in 2026 and 4,349 TWh in 2027, while U.S. data-center capacity is expected to more than triple from 2024 levels by 2030 to roughly 125 GW. This is becoming an electricity infrastructure cycle, not just a semiconductor cycle.
The demand is already showing up across the stack. Eaton’s Electrical Americas data-center orders were up roughly 240% YoY, with backlog up 44%. Vertiv is sitting directly in the middle of this buildout across critical power, UPS, power distribution and thermal management. FY2025 revenue reached $10.23B, up 27.7%, while backlog hit $15B, more than doubling YoY.
Q2 2026 accelerated the story: $VRT generated $3.27B revenue, up 24%, adjusted operating profit of $738M, up 51%, adjusted EPS of $1.52, up 60%, and $925M adjusted FCF, up more than 200%.
Management raised 2026 guidance to roughly $14B revenue, $6.65–$6.75 adjusted EPS and $2.5B FCF. This is what a real AI infrastructure compounder looks like when the demand starts flowing through the income statement.
And $VRT just made the stack even more interesting. Its planned $1.45B acquisition of UtilityInnovation Group, with up to another $1.15B earnout, moves Vertiv upstream into microgrids, onsite generation orchestration, behind-the-meter power architecture and grid interconnect.
In other words, Vertiv is no longer just helping cool and power the rack — it wants to help solve how the site gets power in the first place.
So yea we’re gonna rip gang.
Then look at generation. $GEV now has a $176B backlog, Q2 orders of $24.2B, and gas-equipment backlog plus slot reservations of 116 GW, targeting at least 125 GW by year-end. It is also working toward roughly 30 GW of annual gas-turbine production by 2030. Data-center electrification orders alone topped $5B in the first half of 2026.
That creates the opportunity most people aren’t connecting: time-to-power. When traditional generation and grid timelines don’t match the speed of AI construction, developers need alternatives — behind-the-meter generation, modular gas, reciprocating engines, fuel cells and steam-cycle systems. FastPower-type projects are already being built around 1.2 GW and $2.4B of generation capacity.
Then look downstream. $PWR reported $9.56B Q2 revenue, $33.6B RPO and $53.4B backlog, up 21.5% from year-end 2025. The money is spreading from compute into generation, electrical equipment, transmission, substations and construction.
That’s what I’m researching: the cross-stack bottlenecks. $GEV shows you the generation shortage.
$VRT shows you what happens between the power source and the rack. $ETN shows you the electrical path. $PWR shows you the grid buildout. But underneath those giants are smaller companies solving specific problems that become more valuable as the system gets constrained.
That’s where I’m hunting.
Not the crowded chip trade.
The overlooked infrastructure underneath it — before the market connects the dots.
Subscribe to see the hidden layer I just posted. the smaller companies, overlooked bottlenecks and infrastructure plays most investors haven’t connected yet.


$OUST I added my second tranche at $31.66, and the latest news from Stereolabs makes me even more interested in the business behind this recovery.
I came across this announcement through Top Tier Newswire app.toptiernewswire.com/ the platform built by @Atlantastanian that I recently started using. The news feed picked up The Fly's October 27 report about Stereolabs launching its ZED Box 2 Series.
Another good example of why I appreciate having a dedicated newswire alongside my research and charting tools.
And after going through the announcement, I think this development deserves more attention than a simple product launch headline.
Let me explain why.
Ouster acquired Stereolabs in February 2026, expanding its business beyond lidar sensors into cameras, AI computing, sensor fusion and perception software.
Now we are starting to see what that combination can produce.
The new ZED Box 2 is an industrial AI computer designed for autonomous robots, industrial automation, humanoids and other machines that need to understand their surroundings and make decisions in real time.
The technology is interesting, but the business application matters more to me.
Imagine an autonomous robot moving through a warehouse.
It needs to detect obstacles, recognize objects, understand distances, navigate around people and coordinate its movements.
Cameras provide visual information. Lidar measures the surrounding environment in three dimensions. Additional sensors provide information about movement and position.
But all that information has to be synchronized, processed and interpreted.
That is what the ZED Box 2 is designed to do.
It connects multiple sensors, processes their data and runs AI models directly on the machine instead of depending entirely on remote cloud computing.
The standard model uses NVIDIA Jetson Orin NX processors with up to 157 TOPS of AI processing capacity.
The more powerful ZED Box 2 Max uses $NVDA Jetson Thor technology, offering up to 2,070 FP4 TFLOPS and 128GB of memory.
Both support up to eight synchronized camera inputs, allowing robots to build a more complete picture of their surroundings.
And the Max is designed to support advanced AI models that connect visual perception with robotic actions.
But here is what I find most important for $OUST as a business.
Ouster is moving toward offering a more complete perception system rather than depending only on individual sensor sales.
A customer can potentially obtain lidar, cameras, onboard computing and perception software through the same company.
That could reduce integration complexity, shorten development time and increase the value Ouster provides per robotic system.
And if customers begin deploying larger fleets of autonomous machines, those opportunities could extend beyond a single prototype.
There is already some commercial foundation behind Stereolabs.
Before the acquisition, the company had shipped more than 90,000 ZED cameras to over 10,000 customers.
It generated approximately $16M in revenue during 2025 and was EBITDA positive, according to Ouster's acquisition announcement.
This matters because Stereolabs was not acquired as an early research project without customers or products.
And Ouster itself reported Q2 revenue of approximately $55M, growing 56% year over year, with more than 17,000 lidar and camera sensors shipped.
There is an operating business behind this strategy.
The new ZED Box 2 models are available to order, with initial shipments beginning in October and the Max expected to begin shipping at the end of November.
That is encouraging, but I want to make an important distinction.
A product launch is not the same as confirmed large scale commercial adoption.
We do not yet know how many customers will order these new systems, how much incremental revenue they will generate or what margins Ouster can achieve.
And using NVIDIA processors does not mean Ouster has secured a major revenue contract with NVIDIA.
Those are separate questions that future results need to answer.
Now, coming back to my trade.
I originally became interested in $OUST because the chart was forming a potential bottom around $27 to $28.
The 4H structure started improving, buyers defended support, and the stock began recovering important technical levels.
I added my second tranche at $31.66, bringing my average entry to approximately $30.62.
On October 27, $OUST closed at $32.79, gaining 10.37%.
The Stereolabs announcement was released that morning, although I cannot establish how much of the stock's move was directly caused by that news.
My addition was based on technical improvement, not an assumption that a new product would automatically send the stock higher.
But I like seeing the technical recovery accompanied by positive developments in the underlying business.
That is the combination I am looking for.
The stock needs to prove that buyers can retain the recovery, while the company needs to prove that its growing product portfolio can translate into stronger financial results.
And there is still considerable resistance overhead.
I am watching $32.90 for immediate price acceptance, followed by the important $34.73 to $36.55 resistance area.
A sustained recovery through that region would improve the technical picture considerably.
Below, the $29.84 to $31.67 support area remains important. Losing that structure would weaken the recovery, while a decisive break below $27.35 would seriously challenge my original bottoming thesis.
There is also an important catalyst ahead.
Ouster reports Q3 earnings on November 3, after the market closes.
I want to hear more about Stereolabs integration, customer demand, product shipments, margins and how management plans to monetize the broader sensing and perception platform.
That earnings event also introduces substantial gap risk, so I am not rushing to add the final tranche just because I like this announcement.
My final read.
I am pleased with my decision to build the $OUST position gradually.
The technical setup has improved since the original support test, and this announcement gives me additional evidence that Ouster is expanding its commercial capabilities in physical AI.
But I won't confuse a promising business development with a guaranteed successful investment.
Good technical location. Improving recovery structure. Expanding product capabilities. Commercial execution still needs proof.
For now, I like the direction of the business and the progress of the trade.
Now I want both the financial results and the chart to confirm the next phase.
And another thank you to @Atlantastanian for Top Tier Newswire. This is not a paid promotion. It is simply one of the tools I use to follow company developments, and this is another example of its usefulness.
app.toptiernewswire.com/
Research helps me understand the business. Charts help me manage the trade. Timely news helps me recognize when something important changes.
My trading journal, not financial advice.


$OUST. I added my second tranche at $31.66. The bottoming structure is improving, but the weekly reversal is not confirmed yet.
I have been following $OUST closely after identifying a potential bottom around $27 to $28. The idea was to build a swing position gradually as price started proving that selling pressure was losing control.
Yesterday, October 27, the stock gained 10.37%, closing at $32.79 on increased volume. This morning, October 28, my charts showed approximately $33.37 in premarket trading.
My average entry is now $30.62.
So what changed, and why did I add?
The most important development is on the 4H chart.
Price tested the $27.35 to $28 area twice, creating what looks like a developing double bottom. Buyers then pushed price above the intervening recovery high around $30 to $31.
The fast moving average Ribbon is beginning to turn upward, and the recent candles show improving price structure.
That is more meaningful than simply seeing one green candle after a selloff.
The daily chart is improving too, but it still needs confirmation.
My second entry at $31.66 was positioned near the upper boundary of the daily support zone between $29.84 and $31.67.
The daily DRE has improved from BOTTOM / WATCH / LOW to BOTTOM / WATCH / MIXED.
That tells me the early reversal pressure is becoming more constructive, but the system has not confirmed a retained reversal.
And this is where I want to be careful.
The weekly chart still has significant resistance overhead.
The weekly resistance shelf extends from approximately $32.99 to $38.25, while the weekly Ribbon remains an obstacle around $35 to $37.
This means the stock has moved from an attractive support location directly into an important resistance test.
Good structure improvement, but not an easy location for someone entering fresh today.
Here are the levels I am watching.
The immediate test is whether $OUST can hold above $32.90 to $33.73 during the regular session.
The next important resistance is $34.73 to $36.55. If buyers manage to reclaim and retain that area, I would begin looking toward $37.45 to $38.25.
A stronger recovery could eventually open the path toward $40.74 to $42.56, but I am not treating those levels as guaranteed targets.
On the downside, I want to see $31.08 to $31.67 hold during any controlled pullback.
A sustained move below $29.84 would weaken the recovery structure. A decisive break below $27.35 would seriously undermine my bottoming thesis.
There is also one important event approaching.
$OUST reports Q3 earnings on November 3, after the market closes.
That introduces gap risk regardless of how attractive the technical setup might look. A strong chart cannot protect a position from an unexpected earnings reaction.
So I am not rushing to complete the position simply because the first two entries are showing a profit.
My current technical assessment:
Setup type: Early bottoming reversal, with improving 4H structure.
Structure grade: B-. Meaningful recovery progress, but weekly confirmation is still missing.
B2 entry grade: B-. Good structural location, although the add was made before a fully validated retest.
Current fresh entry grade: C+. Improving chart, but resistance is too close for an aggressive chase.
Opportunity score: 6/10. Conditional, not confirmed.
Action bias: Hold / watch. No blind averaging, no full size chase. Another add would require a successful resistance reclaim or a constructive retest of support.
My final read.
The position is developing in the direction I was anticipating. The double bottom attempt is producing actual upward progress, the daily indicators are improving, and buyers have started reclaiming important levels.
But this is still an early recovery, not an established new uptrend.
I like the entries I have already made more than I like the current location for a fresh one.
Good recovery progress. Resistance immediately ahead. Now let price prove whether this is a sustainable reversal.
My trading journal, not financial advice.


$UCTT Q3 2026
Revenue +48.8%, earnings beat expectations, and management is preparing for a much larger semiconductor equipment cycle. But there is one financial risk I would not ignore.
I went through Ultra Clean Holdings' latest earnings report, management's conference call and the financial statements.
The results are impressive, but I think the more interesting story is where this company sits in the semiconductor supply chain and what its expansion plans tell us about demand for advanced chip manufacturing equipment.
First, the financial results.
Ultra Clean reported record Q3 revenue of $759M, growing 48.8% year over year and 17.7% sequentially.
Adjusted EPS reached $1.15, beating expectations of approximately $0.94. GAAP EPS came in at $0.85, compared with a loss of $0.24 in the same quarter last year.
GAAP net income attributable to the company reached $39.1M, while adjusted net income increased to $53.2M.
Non-GAAP gross margin improved to 17.3% from 16.7% in Q2, and operating margin expanded from 7.0% to 9.0%.
Revenue is accelerating, profitability is improving, and the company is gaining operating leverage.
But before discussing the growth, I want to explain what this business actually does.
What is Ultra Clean Holdings?
$UCTT is not a semiconductor designer like $NVDA or $AMD, and it doesn't manufacture finished silicon wafers like $TSM.
It operates further upstream, supplying critical components and engineered subsystems used inside semiconductor manufacturing equipment.
Companies like $LRCX and $AMAT build extremely complex machines used to deposit materials onto wafers, remove microscopic layers, and perform other manufacturing processes.
Those machines require precise gas delivery systems, liquid distribution, thermal components, mechanical assemblies and highly controlled manufacturing environments.
That is where Ultra Clean operates.
Imagine a semiconductor fabrication machine performing an advanced etching process.
The machine needs extremely precise quantities of gases delivered at controlled pressures, temperatures and purity levels.
Even small contamination or delivery problems can affect manufacturing yields.
Ultra Clean manufactures and integrates components such as gas delivery assemblies, precision welded structures, thermal systems and larger subsystems that equipment manufacturers install inside their machines.
The company also provides engineering, prototyping and manufacturing services to help customers develop these systems.
As chip manufacturing becomes more complicated, the requirements for those components become more demanding.
And that creates opportunities for suppliers with qualified manufacturing processes, strong engineering capabilities and reliable delivery.
There are two businesses inside Ultra Clean, and their economics are different.
The Products division generated $681.9M in quarterly revenue, increasing approximately 53% year over year.
This is the main growth engine.
It manufactures the physical subsystems and components that semiconductor equipment manufacturers need as they build more machines.
The Services division generated $77.1M, growing approximately 19% year over year.
This business provides specialized cleaning, coating and contamination analysis for semiconductor manufacturing equipment.
And I find this second business particularly interesting.
When semiconductor tools operate inside fabrication plants, chamber components eventually require cleaning, inspection or specialized coating to maintain process performance.
Those services can generate repeat business as the installed equipment base expands and wafer production increases.
The difference in profitability is substantial.
Products delivered a non-GAAP gross margin of 15.9%.
Services achieved 30.1%.
That is almost double the Products margin.
Services currently represent a much smaller portion of revenue, but expanding activity in this business could improve the overall profitability mix.
Management explained that Services growth generally follows Products growth with a delay.
First, equipment manufacturers increase production and deliver new tools.
Then fabrication plants install those tools, increase wafer starts and create additional demand for cleaning and coating services.
This is important because the current equipment expansion could eventually support another phase of Services growth during 2027 and 2028.
But that remains dependent on actual fab production activity.
Now, what is driving the current growth?
Management identified advanced semiconductor manufacturing, particularly etch and deposition equipment, as the strongest contributors.
And the demand is closely connected to two major industry developments.
1. Advanced logic manufacturing.
Leading semiconductor manufacturers are moving toward increasingly complex transistor architectures, including gate-all-around technology.
These manufacturing transitions require additional processing steps and more sophisticated equipment.
That creates demand for the specialized subsystems Ultra Clean supplies.
2. Advanced memory manufacturing.
HBM and next generation DRAM require increasing manufacturing complexity and investment in production capacity.
That creates additional demand for deposition, etch and other semiconductor manufacturing equipment.
And when equipment manufacturers increase production, their subsystem suppliers can benefit.
This is why I find $UCTT interesting as a semiconductor supply chain company.
It can benefit from increasing equipment complexity and capital spending without needing to design the winning AI processor itself.
Of course, that doesn't make it independent of the semiconductor cycle. Quite the opposite.
Its results remain closely linked to how much equipment customers order.
The revenue mix confirms where demand is coming from.
Semiconductor Products represented 86% of total revenue.
Foundry and logic accounted for 52%, while memory contributed 34%.
Services accounted for approximately 10%, with non-semiconductor markets making up the remainder.
That gives us a clearer picture of the exposure.
Ultra Clean is heavily positioned toward the manufacturing equipment required for advanced logic and memory.
But management revealed something even more interesting during the earnings call.
The company is expanding manufacturing capacity ahead of customer demand.
Its additional cleanroom space in Malaysia became operational earlier than expected, contributing to the strong quarter.
Further plans include expanding production in the Philippines, Singapore and the Czech Republic, alongside additional vertically integrated manufacturing in Malaysia and Thailand.
Management expects to reach approximately $4B in annual production capacity during Q1 2027.
And it sees a path toward supporting more than $5B in annual revenue, although reaching that level would require additional investment.
The company expects to spend another $80M to $100M through 2027 and 2028 to support that expansion.
Here is why I find this important.
Management is not simply saying demand looks good.
It is allocating resources, building manufacturing capacity, increasing inventory and working with customers on future production requirements.
Those are real business decisions.
But I want to emphasize something.
Manufacturing capacity is not the same as contracted revenue.
The ability to produce $4B or $5B annually does not mean customers have committed to purchasing that amount.
The company still needs orders, production utilization and profitable execution.
That distinction matters when evaluating future earnings potential.
Another development that caught my attention is the move toward higher value engineering work.
Management announced eight new program wins across etch, atomic layer deposition, physical vapor deposition and lithography applications.
Additional programs are moving through development and qualification.
Historically, part of Ultra Clean's business involved manufacturing components according to specifications supplied by equipment manufacturers.
Now management wants to participate earlier in the design process.
Instead of only building what customers specify, Ultra Clean wants to help develop the subsystem itself.
This could strengthen customer relationships and allow the company to capture more value per semiconductor manufacturing tool.
And once a component is qualified for a complex manufacturing process, replacing that supplier can require additional engineering, testing and validation.
That creates potential competitive durability.
However, these new programs are not immediate revenue guarantees.
Management indicated that some could reach larger scale production over the next two to three years.
Now let's discuss the broader semiconductor equipment outlook.
During the call, management said it expects global wafer fabrication equipment spending to exceed $200B in 2027.
That is a very bullish industry outlook.
For comparison, SEMI's July industry forecast implied approximately $175B in WFE sales during 2027, reaching around $200B in 2028.
So Ultra Clean's management is considerably more optimistic about how quickly industry spending could expand.
I find that important.
Management appears to be seeing strong customer demand and longer planning horizons, but I would not treat its industry forecast as an established outcome.
I want actual equipment orders, factory expansions and customer spending to confirm that view.
And here is where I start becoming more cautious.
The earnings are strong, but cash flow is not keeping up.
Despite reporting positive GAAP earnings and growing adjusted profitability, operating cash flow was negative $42.3M during Q3.
For the first nine months of 2026, operating cash flow was negative $116.7M.
Why?
A large part of the explanation is working capital.
Inventory reached $723.3M, increasing approximately $93M from the previous quarter.
Compared with the end of 2025, inventory has increased by more than $330M.
Management explained that it is purchasing critical components early and maintaining additional safety stock to protect production schedules.
That makes sense during a strong expansion cycle, especially when components become difficult to obtain.
But it also creates risk.
If demand continues accelerating, that inventory supports future shipments.
If demand weakens unexpectedly, the same inventory can tie up capital and pressure cash flow.
This is one of the most important things I want to monitor over the next few quarters.
The business is generating accounting profits, but I want those profits to start converting into sustainable cash generation.
Another issue is customer concentration.
Management disclosed that its two largest customers represent approximately 61% of total revenue.
Previous SEC filings identify $LRCX and $AMAT as its major customers.
There is a positive side to that concentration.
Those relationships place Ultra Clean close to some of the world's most important semiconductor equipment manufacturers.
But there is also risk.
A change in customer orders, internal manufacturing strategy, pricing negotiations or production schedules could materially influence Ultra Clean's results.
Strong customer relationships are an advantage.
Being heavily dependent on a small number of customers is still a risk.
Now comes another detail I wouldn't ignore. Share dilution.
During Q3, Ultra Clean raised approximately $34M through its at-the-market equity program.
During the first week of Q4, it raised another approximately $169M by issuing additional shares.
Management used part of those proceeds to repay its revolving credit facility.
That provides financial flexibility, but existing shareholders also need to consider the effect of issuing more equity.
The company expects approximately 48.9M diluted shares in Q4, compared with 46.2M in Q3.
That means earnings growth needs to be evaluated on a per-share basis, not simply through increasing total profits.
At quarter end, the company held approximately $271M in cash against $635M in long term debt.
The subsequent equity raise and debt repayment changed that position, but I still want to see stronger internally generated cash flow.
And the supply chain itself remains a risk.
Management discussed shortages of mass flow controllers, critical devices used to regulate gases inside semiconductor processing equipment.
Those constraints could continue for another quarter or two.
Ultra Clean reported that it had successfully managed its own shipments, but a shortage at another supplier can still delay completion of the final equipment system.
That is an important distinction.
A company can execute well internally and still be affected by problems elsewhere in the supply chain.
Now, the Q4 outlook.
Management expects revenue between $800M and $860M.
At the midpoint, that represents another approximately 9.4% sequential increase.
Adjusted EPS is expected between $1.11 and $1.35, compared with the approximately $1.16 consensus estimate supplied with the earnings data.
GAAP EPS is projected between $1.02 and $1.26.
The revenue guidance suggests that demand remains strong.
But I will be watching margins and cash generation just as closely as sales.
Management has a longer term target of approximately 20% gross margin at $4B in annual revenue.
That would be an improvement from today's 17.3% adjusted gross margin.
Higher utilization, more internally manufactured components, lower cost production locations and higher value engineering work could help.
But these improvements still need to be delivered.
What does all this mean for the investment thesis?
The bullish argument is that semiconductor manufacturing complexity and equipment spending continue expanding.
Ultra Clean has established customer relationships, manufacturing expertise and growing opportunities to provide more valuable subsystems.
New program wins could increase content per tool, while a larger installed equipment base could support the higher margin Services business.
If revenue growth continues, utilization improves and working capital eventually normalizes, profitability and cash generation could improve considerably.
But the risk case is equally important.
The company remains cyclical, heavily concentrated among a few customers and exposed to supply chain constraints.
Inventory requirements are high, operating cash flow remains negative, and expansion requires capital.
Share issuance also creates additional per-share earnings considerations.
And I have not completed a normalized valuation or current technical entry assessment, so I am not calling this stock cheap simply because earnings are improving.
My current classification: Tracker. Strong fundamental momentum, but more work needed on valuation, cash conversion and chart location.
What would upgrade my assessment?
Continued order growth, more profitable engineering content, stronger Services revenue, sustained margin expansion and positive operating cash flow as inventory growth normalizes.
What would weaken it?
Customer order reductions, inventory buildup without matching shipments, weaker margins, additional dilution without corresponding earnings growth or a semiconductor equipment cycle that develops more slowly than management expects.
My final read on $UCTT.
I see a company benefiting from genuine demand in advanced semiconductor manufacturing.
It has demonstrated substantial revenue growth, improving operating leverage and meaningful relationships with leading equipment manufacturers.
But I want to separate three things.
Industry demand is strong. Business execution is improving. Financial quality still needs further confirmation.
And that last part matters.
The company can report excellent earnings while still consuming cash to support its expansion.
If management successfully converts today's investment in inventory, capacity and engineering into profitable production and stronger cash flow, the business could become considerably more interesting.
But that outcome is not guaranteed.
For me, $UCTT is another reminder that the semiconductor opportunity extends far beyond the companies designing GPUs.
Every advanced chip requires a complex manufacturing process.
Every manufacturing process requires specialized equipment.
And that equipment depends on thousands of carefully engineered components and subsystems.
Ultra Clean operates inside that manufacturing chain.
The demand is visible. The expansion is underway. Now I want to see the cash flow follow the earnings.
My investing journal, not financial advice.
$UCTT
Ultra Clean Holdings Non-GAAP EPS of $1.15 beats by $0.21, revenue of $759M beats by $31.45M
Q3 Non-GAAP EPS of $1.15 beats by $0.21.
Revenue of $759M (+48.8% Y/Y) beats by $31.45M.
Fourth Quarter 2026 OutlookThe Company expects revenue in the range of $800 million to $860 million vs. a consensus of $813.93M. The Company expects GAAP diluted net income per share to be between $1.02 and $1.26, and non-GAAP diluted net income per share to be between $1.11 and $1.35 vs. a consensus of $1.16.
$OUST. I added my second tranche at $31.66. The bottoming structure is improving, but the weekly reversal is not confirmed yet.
I have been following $OUST closely after identifying a potential bottom around $27 to $28. The idea was to build a swing position gradually as price started proving that selling pressure was losing control.
Yesterday, October 27, the stock gained 10.37%, closing at $32.79 on increased volume. This morning, October 28, my charts showed approximately $33.37 in premarket trading.
My average entry is now $30.62.
So what changed, and why did I add?
The most important development is on the 4H chart.
Price tested the $27.35 to $28 area twice, creating what looks like a developing double bottom. Buyers then pushed price above the intervening recovery high around $30 to $31.
The fast moving average Ribbon is beginning to turn upward, and the recent candles show improving price structure.
That is more meaningful than simply seeing one green candle after a selloff.
The daily chart is improving too, but it still needs confirmation.
My second entry at $31.66 was positioned near the upper boundary of the daily support zone between $29.84 and $31.67.
The daily DRE has improved from BOTTOM / WATCH / LOW to BOTTOM / WATCH / MIXED.
That tells me the early reversal pressure is becoming more constructive, but the system has not confirmed a retained reversal.
And this is where I want to be careful.
The weekly chart still has significant resistance overhead.
The weekly resistance shelf extends from approximately $32.99 to $38.25, while the weekly Ribbon remains an obstacle around $35 to $37.
This means the stock has moved from an attractive support location directly into an important resistance test.
Good structure improvement, but not an easy location for someone entering fresh today.
Here are the levels I am watching.
The immediate test is whether $OUST can hold above $32.90 to $33.73 during the regular session.
The next important resistance is $34.73 to $36.55. If buyers manage to reclaim and retain that area, I would begin looking toward $37.45 to $38.25.
A stronger recovery could eventually open the path toward $40.74 to $42.56, but I am not treating those levels as guaranteed targets.
On the downside, I want to see $31.08 to $31.67 hold during any controlled pullback.
A sustained move below $29.84 would weaken the recovery structure. A decisive break below $27.35 would seriously undermine my bottoming thesis.
There is also one important event approaching.
$OUST reports Q3 earnings on November 3, after the market closes.
That introduces gap risk regardless of how attractive the technical setup might look. A strong chart cannot protect a position from an unexpected earnings reaction.
So I am not rushing to complete the position simply because the first two entries are showing a profit.
My current technical assessment:
Setup type: Early bottoming reversal, with improving 4H structure.
Structure grade: B-. Meaningful recovery progress, but weekly confirmation is still missing.
B2 entry grade: B-. Good structural location, although the add was made before a fully validated retest.
Current fresh entry grade: C+. Improving chart, but resistance is too close for an aggressive chase.
Opportunity score: 6/10. Conditional, not confirmed.
Action bias: Hold / watch. No blind averaging, no full size chase. Another add would require a successful resistance reclaim or a constructive retest of support.
My final read.
The position is developing in the direction I was anticipating. The double bottom attempt is producing actual upward progress, the daily indicators are improving, and buyers have started reclaiming important levels.
But this is still an early recovery, not an established new uptrend.
I like the entries I have already made more than I like the current location for a fresh one.
Good recovery progress. Resistance immediately ahead. Now let price prove whether this is a sustainable reversal.
My trading journal, not financial advice.
$OUST I opened an initial B1 position from a total of 3 positions.
This is an aggressive support based entry, not a confirmed trend reversal.
The chart has been correcting for months, but the recent price action around $27 to $29 is starting to show something worth watching.
Sellers are struggling to extend the decline, and price is attempting to build a base around an important support region.
Position snapshot
Current chart price: ~$29.6
Setup type: Early bottom repair
Structure grade: B-
Current entry grade: C+ / B-
Opportunity score: 6/10
B1: Initiated, aggressive
B2: Not earned
Weekly structure
The larger chart is still damaged after the decline from above $60.
Price is now testing the 0.618 Fibonacci retracement around $29.17, close to a historically important price area.
That gives me a reason to investigate the setup, but the weekly reversal is not confirmed.
The latest completed weekly candle was strongly bearish. I need to see actual support defense before calling this a bottom.
Daily structure
This is the main reason I opened the starter.
Primary Support:
$26.65 to $28.41 | STR 76
Primary Resistance:
$29.88 to $31.63 | STR 100
Next Resistance:
$34.91 to $36.67 | STR 97
Price has repeatedly tested the lower region without establishing sustained acceptance below it.
The recent low around $27.37 is particularly important.
There is evidence of an undercut and recovery attempt, but not yet enough to confirm a lasting reversal.
The problem is obvious.
Strong resistance is directly overhead, and the daily Ribbon remains bearish.
Good structural location does not automatically mean good current entry geometry.
4H structure
The recent price action is attempting to establish a local base.
I see stabilization and improving reactions from the lows, but I do not yet see a mature higher high and higher low sequence.
The 4H Ribbon still needs repair.
The DRE on both 1D and 2D is showing BOTTOM / WATCH with low evidence and event conflict.
Early reversal pressure, not confirmation.
**What I want next**
First, I want price to reclaim $29.88 to $31.63 and demonstrate acceptance above that resistance.
A successful retest could provide new evidence for B2.
Alternatively, another controlled support test around $27 to $28, followed by clear seller failure and renewed expansion, could create another opportunity.
I will not add simply because price falls.
What weakens the setup?
Loss of $27.37 would damage the local base.
Sustained acceptance below $26.65 would materially weaken the daily support thesis.
There is also a major event risk.
OUST reports Q3 earnings on November 3, after the market closes. That can create a gap through technical levels in either direction.
I need to account for that before considering additional exposure.
My plan
B1 is established.
B2 remains conditional.
I want price to prove that support is being defended and that buyers can reclaim the falling resistance structure.
No blind DCA.
No full size chase.
Final read
$OUST has an interesting support location and a developing bottom attempt.
But I am buying early evidence, not a completed reversal.
The potential recovery toward $35 to $37 is interesting if the structure repairs.
The current resistance around $30 to $32 is the first real test.
For now, small starter, watch the structure, and let price prove the next phase.
My trading journal, not financial advice.


TAPE Vector retweeted

$Tsla is hiring people with cameras to film everyday actions like wiping a table or folding laundry, in order to train its robots 🤖
Already more than 500,000 hours of data have been collected, with the goal of doubling that by the end of the year.
Visionary or a little dystopian? What do you think? 👇

