

I make semi-entertaining videos; Advocate for Disabled Canadians to receive a livable income #CanadaDisabilityBenefit The280Times Is my name in other places too
- Tweets63.3K
- Following2K
- Followers2.8K
- Likes88.7K








ALT 2224 Days ago A poverty ending Canada Disability Benefit was promised but was never delivered. $200 per month won't do fuck all.

ALT (used AI to cap - may yell) a group of eight Canadian provincial premiers sitting side-by-side at a long conference table covered in black cloth. They're all looking down, signing documents. Behind them stands a row of Canadian provincial flags, including the flags of Ontario, Nova Scotia, BC, Saskatchewan, and Newfoundland and Labrador. Large, bold white text is superimposed across the top of the image reading: "REGARDLESS OF PARTY EVERY SINGLE PREMIER KEEPS THEIR DISABLED CITIZENS IN POVERTY". Directly below each premier on the table's front cloth, a percentage statistic is overlaid in white text: • First premier (left): "50% BELOW POVERTY" • Second premier: "60% BELOW POVERTY" • Third premier: "65% BELOW POVERTY" • Fourth premier: "35% BELOW POVERTY" • Fifth premier: "15% BELOW POVERTY" • Sixth premier: "45% BELOW POVERTY" • Seventh premier: "28% BELOW POVERTY" • Eighth premier (right): "50% BELOW POVERTY" At the very bottom, a horizontal bar features blue, red, and oran


ALT A screen grab of a funeral scene from Lower Decks. Walter Koenig as Chekov has been rendered into the Lower Decks style from an original TOS frame and placed into the picture frame sitting on the Torpedo Casket. R.I.P. Walter written at the bottom.

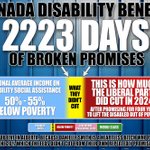
ALT Canada Disability Benefit 2223 Days of broken promises. Horizontal graph / one bar, bar chart. far left of graph "No income" far right of graph "poverty line" within the graph, blue is used to represent disabled social assistance which takes up about 45% of the graph. Yellow represents the actual CDB to come which is roughly 10% of the graph. Red consumes roughly 45% of the graph on the right. Written through the blue "National average income on Disability social assistance 50 - 55% below poverty" written through the yellow "What they didn't cut" written through the red "This is how much the Liberal Party DID cut in 2024 after promising for four years to lift the Disabled out of poverty" under this graph is a second, smaller one which includes this graph, but then shows it in context compared to the distance to "lower middle class" and "middle class" actual. written bottom "Unless you live in Alberta. Because Danielle Smith is a heartless bitch who promised to steal it"

ALT 2223 Days ago A poverty ending Canada Disability Benefit was promised but was never delivered. $200 per month won't do fuck all.

ALT Canada Disability Benefit 2222 Days of broken promises. Horizontal graph / one bar, bar chart. far left of graph "No income" far right of graph "poverty line" within the graph, blue is used to represent disabled social assistance which takes up about 45% of the graph. Yellow represents the actual CDB to come which is roughly 10% of the graph. Red consumes roughly 45% of the graph on the right. Written through the blue "National average income on Disability social assistance 50 - 55% below poverty" written through the yellow "What they didn't cut" written through the red "This is how much the Liberal Party DID cut in 2024 after promising for four years to lift the Disabled out of poverty" under this graph is a second, smaller one which includes this graph, but then shows it in context compared to the distance to "lower middle class" and "middle class" actual. written bottom "Unless you live in Alberta. Because Danielle Smith is a heartless bitch who promised to steal it"

ALT 2222 Days ago A poverty ending Canada Disability Benefit was promised but was never delivered. $200 per month won't do fuck all.


ALT Canada Disability Benefit 2221 Days of broken promises. Horizontal graph / one bar, bar chart. far left of graph "No income" far right of graph "poverty line" within the graph, blue is used to represent disabled social assistance which takes up about 45% of the graph. Yellow represents the actual CDB to come which is roughly 10% of the graph. Red consumes roughly 45% of the graph on the right. Written through the blue "National average income on Disability social assistance 50 - 55% below poverty" written through the yellow "What they didn't cut" written through the red "This is how much the Liberal Party DID cut in 2024 after promising for four years to lift the Disabled out of poverty" under this graph is a second, smaller one which includes this graph, but then shows it in context compared to the distance to "lower middle class" and "middle class" actual. written bottom "Unless you live in Alberta. Because Danielle Smith is a heartless bitch who promised to steal it"

ALT 2221 Days ago A poverty ending Canada Disability Benefit was promised but was never delivered. $200 per month won't do fuck all.


ALT Canada Disability Benefit 2220 Days of broken promises. Horizontal graph / one bar, bar chart. far left of graph "No income" far right of graph "poverty line" within the graph, blue is used to represent disabled social assistance which takes up about 45% of the graph. Yellow represents the actual CDB to come which is roughly 10% of the graph. Red consumes roughly 45% of the graph on the right. Written through the blue "National average income on Disability social assistance 50 - 55% below poverty" written through the yellow "What they didn't cut" written through the red "This is how much the Liberal Party DID cut in 2024 after promising for four years to lift the Disabled out of poverty" under this graph is a second, smaller one which includes this graph, but then shows it in context compared to the distance to "lower middle class" and "middle class" actual. written bottom "Unless you live in Alberta. Because Danielle Smith is a heartless bitch who promised to steal it"

ALT 2220 Days ago A poverty ending Canada Disability Benefit was promised but was never delivered. $200 per month won't do fuck all.

ALT Canada Disability Benefit 2219 Days of broken promises. Horizontal graph / one bar, bar chart. far left of graph "No income" far right of graph "poverty line" within the graph, blue is used to represent disabled social assistance which takes up about 45% of the graph. Yellow represents the actual CDB to come which is roughly 10% of the graph. Red consumes roughly 45% of the graph on the right. Written through the blue "National average income on Disability social assistance 50 - 55% below poverty" written through the yellow "What they didn't cut" written through the red "This is how much the Liberal Party DID cut in 2024 after promising for four years to lift the Disabled out of poverty" under this graph is a second, smaller one which includes this graph, but then shows it in context compared to the distance to "lower middle class" and "middle class" actual. written bottom "Unless you live in Alberta. Because Danielle Smith is a heartless bitch who promised to steal it"

ALT 2219 Days ago A poverty ending Canada Disability Benefit was promised but was never delivered. $200 per month won't do fuck all.

ALT Image: tile 1, “Two ways to count” Alt text: Bar chart titled “MAiD led Parliament’s disability time. How much depends on what you count.” December 2019 to October 2026. MAiD’s share of House of Commons floor time on disability priorities: 33%. MAiD’s share of committee hours on disability bills and studies in both chambers: about 77%, estimated. Source: every House of Commons speech in Hansard, via OpenParliament, with committee hours from minutes and LEGISinfo.


ALT Image: tile 1, “Two ways to count” Alt text: Bar chart titled “MAiD led Parliament’s disability time. How much depends on what you count.” December 2019 to October 2026. MAiD’s share of House of Commons floor time on disability priorities: 33%. MAiD’s share of committee hours on disability bills and studies in both chambers: about 77%, estimated. Source: every House of Commons speech in Hansard, via OpenParliament, with committee hours from minutes and LEGISinfo.