

MacroNerd | Investor | Founder @ Privacy-First Wealth Platform Institutional-Grade Charts & Indicators for Macro, Tech & Geopolitics. Updated Daily. Stay Ahead
Helping People Grow Wealth
Joined January 2026
- Tweets32K
- Following976
- Followers3K
- Likes19.6K




Pinned Tweet
Rising oil prices are bad for your wallet, but historically?
They're actually great for your portfolio.
Everyone assumes that when oil spikes, the stock market tanks.
But data since 1986 shows the exact opposite.
The S&P 500 averages a higher return (13.1%) and a higher win rate (84%) in years when oil goes UP, compared to years when oil goes DOWN.
Just stay invested.

$HWM closed at a new 52‑week low, 3.8% down.
It’s the only industrial to snap the sector median of –0.7%.
If you’re holding, the slide could be a sign to reconsider.

The US yield curve is lying about the recession.
It looks healthy on the surface, but the tightening spread is a warning shot.
The yield curve is just the interest rate the US government pays to borrow money for different lengths of time. Right now, it is normal and upward sloping, meaning longer loans cost more. Yet it has flattened by 19 bps over six months. The 10-year minus 2-year spread sits at 34 bps. That is in the 23rd percentile of the trailing two years. In other words, the market is getting nervous about the future, even if it is not screaming yet.
For your wallet, the 10-year yield is 4.99%. That is the reference point for your mortgage. It is up 68 bps from six months ago. If you are refinancing, the door is closing fast. Holding cash is getting better as short-term rates rise, but you are still losing to inflation.
The attached chart shows the move of the last three months. It was a parallel shift up. The 3M yield rose 23 bps and the 10Y rose 31 bps. The whole curve moved up together. This is not a steepening story. It is a flight to quality driven by sticky inflation.
I am betting on bonds over equities right now. If the 10-year yield breaks below 4.50%, I am wrong and I will admit it.
I predict the 10-year yield will test 5.20% by the end of Q3.

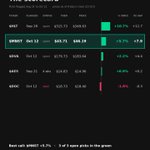
Up 5.7% while the S&P dropped 2.3%, $MNST is still running from our Oct 12 list.
Every pick gets four weeks to work, then we score it right here.
All three picks still running are in the green so far.
A daily close below $42.56 kills the setup.
xitter.cf/TrackNetWorth/status/2…


This week $MNST is the hottest 200 DMA bounce, outperforming 73% of the S&P 500 in 6‑month momentum.
A 200 DMA bounce signals that a stock has found a new support level and is likely to keep rallying.
• $MNST - trading at $43.71, 2.7% above its 200 DMA at $42.56, 6‑month momentum >73%
• $DVA - trading at $179.73, 4.5% above its 200 DMA at $171.94, momentum >80%
• $DOC - trading at $18.73, 0.9% above its 200 DMA at $18.57, momentum >86%
The attached chart shows $MNST's price climbing 2.7% above its rising 200 DMA, while $DVA and $DOC are tightening around their respective levels.
The cleanest setup is $MNST. A daily close below $42.56 would void it, and that level is just 2.7% under the current price of $43.71.
I will report back next Monday whether $MNST holds its 200 DMA at $42.56.
I predict $MNST will stay above $42.56 on Monday.

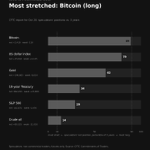
Large speculators are most stretched long in Bitcoin, which sits at percentile 89 of its 3-year range.
The US dollar index is the next most stretched market at percentile 79 with a net position of +15,044 contracts.
Crude oil is the most stretched the other way at percentile 14 with a net position of +89,325 contracts.
Every Friday: who is positioned how.

Calculating the cash yield on total property value gives you a clean benchmark for asset productivity before leverage is factored in.
At the time of this dashboard snapshot, net worth was $764,043, crossing the $500,000 target achieved at 100%. Total assets included investments of $386,000 across 3 portfolios showing a +19.0% average CAGR, and real estate with $570,000 property value across 4 assets generating $70,200 in annual cash flow.
The calculation:
Step 1: Take your total annual real estate cash flow. On this screen, annual cash flow is $70,200.
Step 2: Take the total property value of those assets. On this screen, property value is $570,000.
Step 3: Divide annual cash flow by total property value ($70,200 divided by $570,000) and multiply by 100.
Mine lands at 12.3%.
Run this arithmetic on your real estate portfolio tonight. What is your cash yield on value?

Attention on $MRNA entered the top 10 most-discussed stocks the same day it fell 17.6% to $202.63.
Analysts weigh in on cancer vaccine results, but it sits 149.1% above its 200-day average. How are traders playing a drop this size?

Next week is a replay of the "strong data, strong Fed" trap.
1. Wed 28 Oct: US Federal Funds Rate stays at 4.00%. The real story is the FOMC Statement and Powell's press conference, where any hint of next year's path will move yields. Thu 29 Oct: US Advance GDP q/q estimates 3.0% vs 2.2% previous. This is the growth anchor.
2. Russia securing its role as China's top oil supplier means energy flows are hard-wiring themselves away from Western sanctions. It locks in a new trade reality for the week.
3. Enterprise software vendors are eating 28% of IT budgets on forced upgrades, which directly threatens the capital available for AI innovation in the near term.
The highlight on the attached board is the US Advance GDP. The estimate jumps from 2.2% to 3.0%.
If GDP prints above 3.0%, expect the market to assume the Fed stays tight for longer, pushing long-dated yields higher. Below 3.0%, the "soft landing" narrative gets a boost and risks assets rally.
Into this week, I would rather own quality tech names than long-duration bonds until I see the GDP number. If it misses 3.0%, I'm wrong and I'll say so.
I predict a 3.5% print. A soft landing that gets priced as a boom.

The CFTC positioning report is scheduled for 3:30 PM New York time today.
Brent oil delivered the biggest overnight move at +0.9%.
Gold moved -0.3% over the same period.
The market's day in one card, every weekday morning.

The boring mechanism: systematic monthly tracking of rental income and expenses.
Everyone wants the exciting alternative: chasing high‑yield stocks and market timing. This did more: By logging each dollar, you know the exact cash available to reinvest, avoid hidden costs, and build a buffer that grows with the property.
I keep this in NetWorthNav. The screen shows avg monthly income $6,217, avg monthly expenses $400, net monthly cashflow +$5,817, 12‑month total net cashflow +$69,800.
What is the net cash flow from your rental after deducting routine maintenance and management fees?

$FDS closed at a new 52‑week high of $319.91, the first in 11 months and one of just 25 S&P 500 stocks today.
It beat its financial peers (+2.4% vs +0.5%) and the market (+0.2%), showing strength beyond the sector.
The next hurdle sits at 247.79.

$KRE is up 2.1% to $71.72, its biggest 2‑hour rise since April 2026 – about 15 times a normal move.
The S&P 500 slid 0.4% in that window, so the surge is company‑specific.
Flagstar Bank earnings buzz might be keeping the regional banks ETF on a roll.
$PG is trading at $165.44, up 5.5% 20 minutes into the regular session.
The move has grown since the pre-market reading of +2.7%.
Reported EPS came in at $2.00 against $1.89 expected, a beat by $0.11.
Earnings season: what the options expected against what really happened.

The $44 trillion US GDP forecast for 2030 is not a dream, it is a capex trap.
Anthropic co-founder Jack Clark claims AI will expand US economic output to $44 trillion by 2030. Meanwhile, vendors are consuming 28% of enterprise software budgets on unwanted upgrades. This mismatch is the core risk.
Globe Telecom has already generated P1.2 billion in business gains from AI. This proves productivity is real, not just hype. The winner is the enterprise that actually ships. The loser is the firm stuck in a licensing maze.
Workers will face a skills gap, not just job loss. India’s Piyush Goyal says AI creates more jobs than it replaces, but only if you retrain. If you don’t, your role becomes obsolete within two years.
Most people think quantum is a 2050 story. Google’s 40x error reduction on the Willow chip proves it is a 2027 security threat. Bitcoin cryptography is on the clock.
The chart shows Biotech & Health enjoying a 4.1% stealth rally despite minimal news flow. The money is positioning before the headlines hit.
I’d rather own healthcare AI than chase quantum hype. If bitcoin:native price action shows no quantum fear by mid-2027, my view is wrong.
Pretend quantum risk isn’t here yet.
Every Thursday: which tech headlines the money actually believed.

With Q3 earnings in focus, $SPOT is up 3.7% in pre-market to $545.00, its biggest one-hour rise since 21 May.
The S&P 500 moved +0.2% in that window, showing this surge is entirely company-specific.
It keeps the stock above its 200-day average of $496.48.
$GDX popped up 0.6% today on volume that ran 1.5x its usual pace.
The S&P 500 barely moved 0.2%, proving this isn’t a broad rally.
This could mean the 5x speed hike is starting to pull the ETF off its 200-day average.
The $1,600 in annual expenses on this rental is the real driver of its performance.
Everyone looks at the 18.56% net yield. This one tells you more:
A $1,600 expense base means the cash flow is $28,400 after costs, which is 94.7% of the gross rent. It shows that low overhead is what makes the 18.56% possible, not just the rent amount.
When you compare properties, focusing on expense ratio (expenses divided by rent) can flip a marginally higher rent property into a worse investment if its costs are higher.
What is your own expense-to-rent ratio for any property you own or consider, expressed as a percentage?

$MSTR is up 8.0% on the day, with a $211 target price in focus.
That recent surge was about 8 times a normal hour's move while the S&P 500 only ticked up 0.4%.
The stock is decoupling from the broader market and running on its own momentum.