

SEBI Registration name & number - https://nitter.gq/t.co/GnI1OIFxwz SEBI Reg Name: Groww Invest Tech Pvt Ltd SEBI Reg No: INZ000301838 RA No: INH200008662
Bengaluru
Joined February 2023
- Tweets2.4K
- Following5
- Followers5.6K
- Likes328



Muhurat Trading falls on 8th November, Sunday this year.
But do markets follow a repeating pattern around it?
We tested the last six years data and here’s what we found
Muhurat Intraday moves:
After the opening, the picture changed.
• Nifty and Sensex closed below their opening levels in five of six sessions, with average open-to-close returns of −0.12% and −0.21%, respectively.
• Both indices traded within an average session high–low range of around 0.4%.
• Crude moved higher after opening in five of six sessions and was nearly flat in the other. Its average intraday gain was about 1%.
• Gold showed no consistent direction. In 2025, its session range widened sharply from the previous year, while Crude’s narrowed.
For indices, the strength was in the opening gap. For crude, it was more often within the session.
The episode is out. Watch the full breakdown here: youtu.be/0Gtv5YVBfcQ?si=QOQw…

Chart Gym is back!
Study MIDHANI’s daily chart from May to November 2023.
Mark where you’d enter, how you would manage it and exit.
Then catch @iManasArora break it down in the next episode of Chart Gym!
Chart Gym is back!
Study MIDHANI’s daily chart from May to November 2023.
Mark where you’d enter, how you would manage it and exit.
Then catch @iManasArora break it down in the next episode of Chart Gym!
Join @Nick_khandelwal as he breaks down the market moves and what lies ahead.
Live at 4 PM.
nitter.gq/i/spaces/1MKgNbkRMQbxL

CAS will no longer decide the F&O settlement price on expiry day.
Here’s what SEBI’s new rules mean. 🧵
What could this mean for expiry-day traders?
If you’ve noticed different premium-decay patterns on recent expiries, uncertainty around the eventual CAS settlement price may have contributed.
Under the revised framework, expiry settlement will use cash-market trades completed by 3:30 pm.
The subsequent auction will no longer determine that value.
Removing this uncertainty could bring premium behaviour closer to the expiry-day patterns traders were familiar with before CAS-based settlement.
But familiar patterns aren’t guaranteed. Price moves, volatility and liquidity can still cause sharp premium fluctuations.
Watch how the changes play out before assuming earlier decay patterns, or strategies built around them, will return.
Link to the SEBI circular - sebi.gov.in/legal/circulars/…
Have you noticed a difference in expiry-day premium behaviour since CAS was introduced?
Let us what you think in the replies below.
Market outlook 🧵
Sensex's price action yesterday unfolded in two phases: a 300-point morning range followed by a breakdown.
Two key levels to track:
72,300 on the downside
73,500 if yesterday’s high is taken out
The highest put OI is at 72,000, while the highest call OI is at 73,000.
With PCR at 1.11, positioning remains almost neutral.
The straddle closed at 553, implying a 0.76% move for today’s expiry.

On the commodities front, crude oil is up 2.65% this week.
The 8,500 level has flipped from resistance to support, with crude attempting to break above the 9,000–9,100 zone.
OI is concentrated around 9,000–9,200 strikes and PCR stands at 1.33.
The straddle had closed at 244, pricing in a 2.74% move.
Most traders use open interest to mark support and resistance.
But does price actually reverse at these levels?
We tested it across 1,600+ Nifty sessions from January 2020 to August 2026.
Here’s what we found 🧵
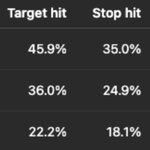
The downside result became even more concentrated on expiry sessions.
Non-expiry: 211 trades, +748 points.
Expiry: 90 trades, +1,827 points.
Less than 30% of the downside trades generated roughly 71% of their gross profit.
But this was not a near-perfect expiry signal. Only 47 of the 90 expiry trades were profitable.