

7+ years in markets. Flagged $60k as $BTC’s bottom. Called TSLA’s peak ~1% below it. Calculated gold’s peak months ahead within ~3.6%.
🇨🇴
Joined August 2024
- Tweets2.8K
- Following32
- Followers4.4K
- Likes4.1K





Pinned Tweet
4 months of correctly predicted price action so far.
Minor tweak: because Feb’s low was breached, the HTF MSB now sits at 82.8k. Break that level and the probability that we’re in a new uptrend rises above 90%.
$BTC #Bitcoin


$BTC HTF Update
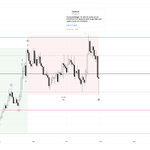
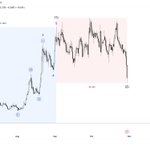
As much as I’m a HTF bull, I must admit that the move from the February 6 low to the high 70s appears corrective. Therefore, it looks like the max pain scenario from here—for both bulls and bears—is more chop.
A month ago I flagged a possible expanding leading diagonal (see this post: nitter.gq/TraderJBx/status/20351…), and then we got a correction down to the March 29 low. Normally, this 1-2 is followed by a strong wave 3, but the move from March 29 to now has been too slow, too overlapping, too easy to get into, and has left far too much stops/liquidity behind. There are LTF impulses, but they feel forced, the corrections between them are excessively long, and when you zoom out the structure simply doesn’t look like a true impulse. It could very well be an inverted ABC.
If this read is correct, it becomes more probable that the C wave of this HTF expanded flat contains an extended wave 1, the advance from the February 6 low to the present is wave 4, and we still have a final downward wave 5 to complete (as shown in the attached chart and the right-hand chart in the quoted post). It remains to be seen whether wave 5 will sweep the $60k low (full impulse) or truncate. Either way, what follows should mark the true start of the next impulsive uptrend.
I have to admit this scenario would be perfect from both a sentiment and technical perspective:
1) Price first pumps above the February high to test/fill the 1D inefficiency (see this post: nitter.gq/TraderJBx/status/20445…). Bulls celebrate, call the correction over and new ATHs are coming… only to get rejected hard.
2) Price then delivers the final downward wave 5 of the expanded flat. Big players take all the liquidity below and shakes out retail.
3) At the lows, bears cheer and declare the “bear market” is back… only for price to find strong support and immediately begin the next uptrend.
4) Neither bulls nor bears get the outcome they want. The whole process can easily take considerably longer than expected, leaving both sides impatient, chopped out, and/or forced to exit positions.
The invalidation of this scenario is a clear impulsive HTF market structure break (from mid-air) above the previous HTF lower high: the $97.9k high of January 14.
#Bitcoin

Y, como todo un campeón, $CRV cierra el día de vuelta dentro del rango. La zona de demanda verde ahora está apropiadamente retesteada ✅
#CurveFinance

$CRV
Oct 1st: “Mentally prepared for more chop” ✅
Two months of chop so far, range low still on the table and RSI trending lower. The ideal scenario to wrap up this correction would be a sweep of the range low (properly testing the green zone), widespread panic, and the 12h RSI entering oversold territory—ideally with a bullish divergence.
I have additional limit bids set at the range low in case this plays out.
#CurveFinance

“This time I got ya” — Brian O’Conner.
The first trade was invalidated, but as explained in the trades post, the yellow one is automatically activated. The internal impulse may be part of an inverted flat or something, but the overall structure now looks like a 1-2.
$XRP

“Ask any trader. Any real EW trader. It doesn’t matter if the impulse holds by a penny or ten grand. Holding is holding.”
— Dominic Toretto
$XRP


$CVX
The breach of the Oct 15th low means we are still correcting in wave (2), which is now similar in duration to wave (1). At the local top, a follower asked what I would do if I didn’t already have a bag, and my answer was to wait for a correction first. That correction has now arrived.
Let this be a reminder: no matter how good the price action looks, resistance levels are for selling or shorting — never buy out of FOMO.
#ConvexFinance

$CVX
Range high reached ✅ This took a lot of patience, but here we are again.
Above current levels sits the 10/10 supply zone, which is expected to be a heavy one. Odds favor consolidation around or below it before a full breakout.
I hope my previous posts helped you see that #ConvexFinance wasn’t over and avoid panic selling at the lows.

ethereum:0xd533a949740bb3306d119cc777fa900ba034cd52
With today’s drop, my wave count is now confirmed and shown on the left chart. In short, we have a large 1-2 structure from June’s bottom at $0.17, similar to CVX. As long as this level holds, wave (3) is ahead and should be more powerful than wave (1). This lines up with the $0.33–0.45 area acting as heavy supply—which is why we’ve been correcting inside it for two months and are now seeing a rejection that flushes late longs and creates panic.
Based on the wave count, price could bottom anywhere above $0.17, but from a pure price-action perspective, we shouldn’t see acceptance back inside the range where we spent most of 2026. As the right chart shows, we just tapped the high of that range almost perfectly in what looks like a retest of the breakout, and the reaction so far has been constructive.
It might be time to start looking into an astronaut suit.
#CurveFinance


Filled ✅ Faster than expected.
$CRV #CurveFinance
$CRV
Oct 1st: “Mentally prepared for more chop” ✅
Two months of chop so far, range low still on the table and RSI trending lower. The ideal scenario to wrap up this correction would be a sweep of the range low (properly testing the green zone), widespread panic, and the 12h RSI entering oversold territory—ideally with a bullish divergence.
I have additional limit bids set at the range low in case this plays out.
#CurveFinance
$CRV
Extended the range as shown on the chart. Fourth RSI divergence on the 12h timeframe, SFP of the range high so far, range low remains unswept.
Mentally prepared for more chop, and treating any breakout as a welcome surprise if it comes.
#CurveFinance

$BTC
Well, now you know why it was important to avoid a daily close below $81.2k. We’ve had 6 days of annoying chop below it so far, and it’s now acting as resistance. This doesn’t mean we should flip bearish — quite the opposite. But if I were a whale/mm, I’d keep price chopping around these levels until the end of the month and then sweep the previous monthly low in early November.
I honestly don’t think we’ll get a sweep of $74.9k to print a similar structure to early 2023, simply because this structure is a bit different, but who knows. My worst-case scenario right now is a retest of the gray demand zone.
#Bitcoin


Imagínate estar cientos de millones de dólares en verde, al inicio de un nuevo mercado alcista, haber atraído turismo e inversión a tu nación, y que aun así digan que @nayibbukele fracasó...
¿Qué dirán cuando $BTC cueste $250,000?

“El Salvador será el Singapur de América Latina”, dijeron directivos de empresas de bitcoin cuando Bukele lanzó el proyecto de convertir a El Salvador en el "país del bitcoin" hace 5 años. Pero, ¿qué ha pasado? 🎥 En este video @anamaroura te cuenta.
bbc.in/4snetrM

Excellent decision to rotate the risk from the $TAO trade into XRP—otherwise, I’d have been stopped out. The origins of impulses are the best invalidation levels in trending markets.
That said, I’m still bullish on #Bittensor. With BTC looking bullish too, a break of this diagonal should allow an attempt to at least take out the liquidity at the local high.

$TAO
Perfect retest of $270.8 on the weekly timeframe so far. The two most important lines right now are marked on the chart. As long as we hold the green line as support, we’ll likely get another chance to break out above the red diagonal resistance—in which case price should fly. If price keeps compressing inside the triangle, a resolution should come before the end of 2026.
The trade from the quoted post remains valid, but I’ve allocated that risk to XRP, so I’m no longer taking it here on #Bittensor.

$BTC
One month has passed since the warning at the local top about this correction. However, since we haven’t convincingly lost the $80k level, the extension scenario remains alive.
As a reminder, I currently have two wave counts in mind for the structure from the bottom:
1) The count shared in the left chart, where wave (v) is already complete and we are now in the circled wave ii. it would fit well as the correction from the local top is now –9.35% — the deepest so far since the bottom — and has lasted longer than wave (iv).
2) The count shared in the right chart, where we are still in wave (ii) of circled wave v, with invalidation at $74.9k.
Right now, it's a coin flip regarding probability. More price action is needed to confirm which wave count is correct, but the HTF compass still points north.
#Bitcoin

$BTC
Five waves have now printed from the $57.8k low, so that level officially becomes the invalidation for the bullish HTF market structure. I don’t want to kill the vibe, but waves (iii) and (v) are showing the classic bearish RSI divergence. On top of that, some bears who completely lack humility are already admitting they were wrong and flipping bullish, so a 2–3 month correction wouldn’t surprise me.
Of course, there are more bullish paths—extensions that keep sending price higher, so yes, 'up or down' post but the goal here is not to choose a short-term direction, it’s just to suggest caution. The most probable medium- to long-term direction remains up, and we now have a clear invalidation level.
If the bearish RSI divergence plays out, #Bitcoin should print a local top inside the red supply zone or slightly above it. ETH and TOTAL3ES are showing the same structure and RSI divergence.

People saying that $80K is holding for $BTC. NO it is not. Perfect time to short. People in denial, and lack experience, common sense.
Bitcoin is going lower.
- Wynn


$CRV
I know it's annoying to wait for these consolidations to fully develop, but I actually prefer them over the fast, inefficient moves like the ones shaded in red. Why? Simple: in the event of a future correction, they should act as solid support. As you can see, after the red inefficient moves, price had little trouble retracing them.
Let nature take its course. The days of celebration are coming.
#CurveFinance

Clear downward impulse from $84.9k on the 30-minute timeframe. $81.2k liquidity swept into support and w3–w5 RSI bullish divergence. If we're going to bounce, it should be from around here.
We need to reclaim the origin of this impulse to invalidate it, preferably in an impulsive manner.
$BTC #Bitcoin

