

My post is to make you a consistent and profitable trader. Prov.16.1
Anambra, Nigeria
Joined September 2026
- Tweets537
- Following35
- Followers166
- Likes1.3K



That completes risk management 🛡️
Size by risk, set the stop by the chart, aim for a good reward, and set limits to protect yourself.
Next up: TRADING PSYCHOLOGY 🧠
❤️ Like, 🔁 share and follow so you don't miss it.
Keep in mind ⚠️
The figures here, such as 1% to 2% risk and a 3% daily limit, are common teaching guidelines, not advice.
Your own limits depend on your account and experience. Practise on a demo account first.
Habits that protect you ✅
Always use a stop loss
Never move a stop further away
Don't risk more to win back a loss
Keep a trading journal
Avoid over-trading
Set your limits 🚧
Many traders use a daily loss limit, such as 3% of the account, and stop trading once it is hit.
Stopping early protects both your money and your judgement.

Drawdown 📉
The drop in your account from its peak.
A losing streak is normal. At 1% risk, 10 losses in a row cost about 10%.
At 10% risk per trade, the same streak would cost the whole of your account.
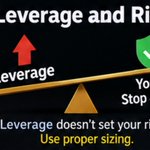
Leverage and risk ⚡
Leverage does not set your risk. Your stop loss and position size do.
High leverage just makes it easy to open a position far too large for your account. Use the sizing method from Part 1.

Spreads and costs
Spreads and commissions are a cost on every trade, so real results are slightly lower.
Very tight stops suffer most, because the spread takes a bigger share of the risk.

Example 🧮
10 trades, $10 risked each, 1:2 RR, and only 4 winners.
Wins: 4 × $20 = $80
Losses: 6 × $10 = $60
Net: +$20
Even with 60% losing trades, the account grew (before costs).
The other side ⚠️
At 1:1, you must win more than half your trades just to break even, and costs make it harder.
A low RR leaves very little room for error.
Why it matters 💡
With a good RR, you can be wrong often and still profit.
At 1:2, you only need to win about 1 trade in 3 to break even, before costs.

Risk-to-reward ratio (RR)
How much you stand to gain compared with what you risk.
Risk 13 pips to target 52 pips = 1:4. The reward is four times the risk.
Risk 10 pips to target 10 pips = 1:1.


In Part 2, we cover risk-to-reward, win rate, leverage and drawdown.
❤️ Like, 🔁 share and follow so you don't miss it.
A common mistake ❌
Choosing a lot size first, then squeezing the stop to fit it.
That puts your stop inside normal price movement, so you get stopped out before your idea has a chance to play out.

Notice what happened.
The chart set the stop. The risk set the lot size. The two work together.
A wider stop means a smaller position. A tighter stop allows a bigger one. Either way, the money at risk stays the same.
Step 3: Size the position 🧮
Position size = money at risk ÷ (stop distance in pips × value per pip)
Risk $10 with a 13-pip stop: $10 ÷ 13 = about $0.77 per pip.
At about $0.10 per pip for each micro lot, that is roughly 7 micro lots (0.07 lots).

Step 2: Measure the distance 📏
Count the pips between your entry and your stop loss.
Example: entry at 1.1038, stop at 1.1025. The distance is 13 pips.

