

🎩🔎 Teaching you Supply & Demand Trading Exposing the hidden clues in the charts. Founder @ White Oak Trading University 🌳📈 Institutional Logic • Smart Money
www.whiteoakfx.com
Joined June 2010
- Tweets47.6K
- Following4.8K
- Followers16K
- Likes20.3K




Pinned Tweet
Thank you so much for your interest, and congratulations on being open minded and willing to learn. That alone puts you ahead of most traders.
The best way to get involved with what we teach is to start exploring the free resources we put out every day:
📚 Begin by reading the blog posts on our website. They’ll give you a strong foundation in how institutional buying and selling really works.
whiteoakfx.com/blog
📲 Join our free Telegram community where we share real time insights and updates:
t.me/supplydemandforextradin…
🎥 Watch our YouTube videos and dive into the breakdowns we’ve already done. These will help you see the logic behind the markets clearly.
youtube.com/c/WhiteOakFX
🎙 Participate in our morning live sessions. This is where everything comes together and you get to see the analysis unfold in real time.
🔎 One thing I strongly recommend is going through the YouTube sessions where we reviewed the CFTC data. Those videos explain the institutional sentiment behind the markets and will help you understand why price moves the way it does.
youtube.com/watch?v=Crt5i1ic…
If you ever have questions along the way, just let me know. I'm happy to help guide you.
🚨 #SP500 - first daily 🟩 demand zones were being removed and now weekly 🟩. This means the Monthly chart will play a crucial role in determining long term direction—which for the time being is 📈 upwards.


🚨🟩 DAILY CHART IN PLAY 🚨
The #SP500 currently has the daily chart that is in play. This is something that I have mentioned to you in the past and it is something that you should be recognizing. If this daily demand zone gets taken out, then we will have new institutional 🟥 supply left behind. But more importantly our shift will then go 👆 up one time frame to the weekly chart . There is currently weekly 🟩 demand sitting below price.

🚨 $EURUSD - keep your eye on that weekly 🟩 demand zone. That is the best spot for any potential short/medium term 📈 rally. Not there yet.


🎩🤷♂️ Retail is stubborn. Holding and adding 🟢 Long $EURUSD is just not a good idea. They are massively under 🤿 water and still adding to a loser. This is 🎰 gambling and will not end well. You can be lucky 🍀 here and there but luck runs out. 🤦♂️

🚨📊 $EURUSD - it’s just amazing to me to see how long retail are holding this long position. They’ve got to be seriously under 🤿 water. It’s unfortunate because it looks like more lows are coming.

6
797
😏 Remember when $SNDK was ⛽️ pumped up over 2k and all the reasons you were told it would go higher? Yeah well, 🏦 they took profits on their positions using everyone as liquidity. Now price is almost back at THEIR 🟩 buying zone.

📈📉 #NASDAQ - short term buying turning back into selling. 1 hr chart no longer should be our focus for direction. Now we turn back to the daily chart which has 🟥 supply in play!

🎩🤷♂️ Remember that 1hr 🟥 supply zone on the #NASDAQ I mentioned to you!? It’s been removed. What’s the significance? It’s showing us BIG 💰 MONEY is starting to buy again. Stay tuned!

🎩🤷♂️ Remember that 1hr 🟥 supply zone on the #NASDAQ I mentioned to you!? It’s been removed. What’s the significance? It’s showing us BIG 💰 MONEY is starting to buy again. Stay tuned!
🎩☕️ Mornin!
📊 #NASDAQ – DAILY SUPPLY IN CONTROL, WATCHING FOR A CHANGE IN MOMENTUM
Taking a closer look at the NASDAQ, we can see that price has reacted to the downside from a daily 🟥 supply zone, placing the daily timeframe firmly in play, with institutional selling now representing the main force.
The next step in our 🕵️♂️ Sherlock Analysis Process is to examine the one timeframe lower and determine whether demand zones are holding or being removed. This will help us assess whether institutional selling is likely to continue or whether institutional buying is beginning to regain control.
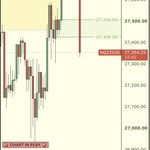
At present, a one-hour 🟥 supply zone around 27,500 has come into play and is holding. I would like to see this supply removed. If that happens, the probability of a rally back towards the daily 🟥 supply zone increases considerably. Once price reaches that area, we can examine the evidence again and determine how the market intends to unfold.

🚨 $EURUSD - daily 🟩 demand is still holding for now. let’s see if bullish engulf is created. Still watching for move lower to weekly 🟩 demand.

🇪🇺 $EURUSD – Watching for a Larger Reversal! 🔍
Price has now made contact with the daily 🟩 demand zone, where we anticipated some short-term institutional buying. We’re seeing that buying materialize right now. 📈
However, the area I’m most interested in is further down the chart: the weekly 🟩 demand zone.
I believe this is the more significant area to watch for a potential larger reversal to the upside, particularly when combined with the possibility of aggressive short-position covering.
Remember, when banks are heavily positioned short, a shift in institutional buying can create the conditions for a powerful move higher as those short positions begin to unwind.
🎯 The weekly 🟩 demand zone is the area I’m watching most closely.
🔎 Analyze the charts like Sherlock. Don’t follow the headlines. Follow the institutional money!
#EURUSD #ForexTrading #InstitutionalTrading
🚫🚦 NO 📡 SIGNAL on #OIL = no short trade activated. Seems the banks are shifting from short-term selling back into potential buying. We will continue monitoring this chart for potential short trades.

🚨 BREAKING NEWS: #GOLD has made contact with the Weekly 🟩 Demand zone.

🥇 GOLD UPDATE | Institutional Selling Remains in Control 🔍
Gold recently contacted a daily 🟩 demand zone, where we saw some very short-term buying enter the market. However, the overall pressure remains firmly to the downside.
As a result, that daily 🟩 demand zone was eventually melted through, and price is now testing another daily 🟩 demand zone further down.
My suspicion is that this area will also be consumed over time as the selling pressure continues to work its way through the market.
🎯 The bigger area I’m watching is the weekly 🟩 demand zone below current price.
This is where I suspect we could see something much more significant develop, potentially bringing a stronger institutional response.
Remember, we’re not interested in guessing where the bottom is. We’re watching institutional behaviour and allowing the price action to reveal their intentions.
🕵️ Analyze the charts like Sherlock.
#GOLD #Trading #SupplyAndDemand
🚨 #OIL UPDATE: That low hasn’t been taken out yet. Still watching.

$NVDA 🕵️♂️ NVIDIA
NVIDIA’s earnings came in very strong, but let’s put the headlines and earnings numbers aside for a moment. 📊
The real mystery we need to solve is what institutional activity is producing on the monthly timeframe.
Will the monthly 🟩 demand zone hold, or will it be removed?
That’s the key question, and it’s why we need to pay close attention to what unfolds throughout this month.
Remember, the monthly candle has not closed. The story is still being written, and we need to let the evidence develop before drawing conclusions.
🔍 Follow the clues, read the institutional footprints, and let the chart reveal the answer.
That’s Sherlock Analysis. 🕵️♂️

🎩☕️ Good morning! I’m in the city 🌆 this am. Staying with my mother today but will be working off my 📱 phone.
How are you guys this morning?
8
938
🎩📡 #OIL - ummm Houston, we made contact!

🛢 #OIL – NEW ONE-HOUR SUPPLY, WATCHING FOR CONTINUED DOWNSIDE 📉
🚨 POTENTIAL TRADE ALERT 🚨
We now have a new one-hour 🟥 supply zone forming on the chart. This is what we call a Bait and Switch, and it could provide an opportunity for a continued move lower.
We have maintained a downside outlook on #OIL since the highs above $100, and the key daily 🟥 supply zone around $89 has now come into play.
🎯 Our objective is to join the existing downside momentum. Members, I will provide the confirmation trade if the setup develops. In the meantime, watch closely for bearish signals from this new one-hour supply area.
🕵️♂️ The next clue is whether institutional selling steps back into the market. 👀

🛢 #OIL – NEW ONE-HOUR SUPPLY, WATCHING FOR CONTINUED DOWNSIDE 📉
🚨 POTENTIAL TRADE ALERT 🚨
We now have a new one-hour 🟥 supply zone forming on the chart. This is what we call a Bait and Switch, and it could provide an opportunity for a continued move lower.
We have maintained a downside outlook on #OIL since the highs above $100, and the key daily 🟥 supply zone around $89 has now come into play.
🎯 Our objective is to join the existing downside momentum. Members, I will provide the confirmation trade if the setup develops. In the meantime, watch closely for bearish signals from this new one-hour supply area.
🕵️♂️ The next clue is whether institutional selling steps back into the market. 👀

📉🔎 $DOW JONES – WATCHING FOR A MOVE TOWARDS 44,000 #US30
The Dow Jones is now declining after reacting to a weekly 🟥 supply zone. This raises the possibility of a deeper move towards 44,000, where significant institutional 🟩 demand is located.
Before that happens, price would first need to remove the lightly tested weekly 🟩 demand around 49,000. Monthly demand near 45,000 has already been tested, adding another important piece to the puzzle.
🕵️♂️ For now, 49,000 and 44,000 are two key levels to keep on our radar. 👀 #DowJones


🚨🔥 IT'S ALMOST HERE… THE WHITE OAK BLACK FRIDAY EVENT IS ABOUT TO BE UNLEASHED! 🔥🚨
If you've been thinking about taking your trading to the next level, this could be the opportunity you've been waiting for!
🎓 Our biggest Black Friday opportunity is just around the corner, and we're preparing something special for those who want to make a serious commitment to their trading education.
Imagine having an entire year to immerse yourself in the Sherlock Analysis Process, study institutional positioning, understand supply and demand, develop your trading methodology and learn how to approach the markets with greater confidence and discipline.
📊 A full year of learning. A full year of market analysis. A full year of developing your skills.
Whether you're looking to become a more disciplined trader, understand what institutions are doing, improve your entries and exits, or finally develop a methodology you can call your own, this is an opportunity worth watching.
🎯 THE COUNTDOWN HAS BEGUN!
We'll be releasing more information before Monday, November 23rd, when our Black Friday event officially kicks off.
And this won't be a one-day promotion…
🔥 IT'S GOING TO BE AN ALL-WEEK EVENT!
Keep your eyes on our announcements. You won't want to miss what's coming.
👇 Follow along and make sure your notifications are turned on!
#BlackFriday
📊🎯 $BRK.B – A PERFECTLY TIMED EXIT! 💰🏦
Taking a closer look at Berkshire Hathaway ($BRK.B), we exited our long position at $595.74, precisely because our 🎯 target-locating system identified this as an area where we were likely to see significant institutional profit taking.
🔎 Now, take a look at the chart and examine what has unfolded since our exit! We are witnessing substantial selling pressure, exactly the type of activity we anticipated when identifying this target. The evidence suggests that large financial institutions are taking profits, and our decision to secure our gains could hardly have been better timed! 💰
🕵️♂️ This is the beauty of the Sherlock Analysis Process. We don't simply guess where price might turn. We investigate the evidence, identify where institutional buying and selling are likely to emerge, and use that information to make calculated trading decisions.
🎯 An excellent example of identifying a high-probability profit-taking area.
