

Macro research for investors. Covering Asia, commodities, currencies, and asset allocation. Sign up for free daily Newsletter: https://nitter.gq/t.co/C4EG0o3TVg
Joined March 2024
- Tweets1.2K
- Following162
- Followers1.8K
- Likes108




🚨 CHINA’S CURRENT-ACCOUNT SURPLUS JUST HIT A RECORD. BUT THE ECONOMIC STORY IS FAR LESS IMPRESSIVE.
China recorded a staggering $735 billion current-account surplus in 2025, more than DOUBLE the $353 billion recorded in 2007.
Yet the comparison reveals a troubling divergence.
2007: Surplus reached 9.8% of GDP.
2025: Surplus represents just 3.8% of GDP.
Despite the record dollar amount, China’s external surplus relative to its domestic economy remains roughly 6 percentage points below its historical peak.
More importantly, the surplus now coexists with weak household consumption, property-sector distress, and deteriorating domestic investment.
YCC Capital sees a dangerous structural pattern: China is increasingly dependent on overseas customers to absorb industrial output that domestic households cannot consume.
A record surplus does not necessarily signal a healthy economy.
It may instead reveal how badly domestic demand is failing.

🚨 CHINA’S $735 BILLION SURPLUS EXPOSES A BIGGER PROBLEM.
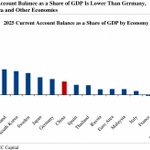
China recorded a current-account surplus equivalent to 3.8% of GDP in 2025. Sounds enormous? Look at the global rankings.
Singapore: 16.7%
Netherlands: 7.9%
Switzerland: ~7.1%
South Korea: 6.6%
Sweden: ~6.1%
Japan: 4.9%
Germany: 4.5%
China: 3.8%
China ranks BELOW all seven.
Meanwhile, the United States runs a current-account deficit of approximately 3.5% of GDP.
YCC Capital’s analysis reveals a critical distinction: China’s external surplus is not exceptionally large relative to its economy. The deeper problem is WHY it exists.
Weak household consumption, excessive industrial capacity, and insufficient productive domestic investment are pushing Chinese savings overseas.
China’s manufacturing machine is powerful. Its domestic demand engine is structurally weak.
That imbalance—not the headline surplus—is the real risk for investors.

America's AI productivity revolution is producing an increasingly uncomfortable labor-market divergence.
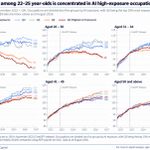
YCC Capital's analysis of employment through August 2026 reveals a striking generational divide.
Among U.S. workers aged 22–25:
Employment in the 20% of occupations most exposed to AI fell to an index of 87, down 13% from November 2022.
Employment in the least-exposed group reached 108, up 8%.
That's a 21-percentage-point divergence.
For workers aged 26–30, the most-exposed category stood near 96.
But among workers aged 35–40, employment remained above baseline across every exposure group, with the least-exposed category reaching approximately 114.
The pattern suggests that entry-level knowledge work is facing particularly intense disruption.
YCC Capital's conclusion: AI may raise American productivity while simultaneously weakening traditional career pathways for younger workers. The economic gains could be substantial—but unevenly distributed.

China is competing aggressively on AI pricing. America continues to dominate the highest-intelligence frontier.
YCC Capital's intelligence-versus-cost framework exposes a widening distinction between technological capability and commercial pricing.
Anthropic's Claude Opus 5.5 achieves an intelligence index near 59 at approximately $8 per task.
OpenAI's GPT-6 Astra scores around 53–54 at roughly $4 per task.
Google's Gemini 4 Argon delivers approximately 52–53 at around $2–$3.
China's MiMo-V2.6-Pro scores roughly 46 at just $0.16.
DeepSeek V4.1 Flash scores approximately 45 at around $0.30.
Chinese models compete aggressively on cost, but the frontier intelligence gap remains meaningful.
Lower prices can stimulate adoption while simultaneously undermining profitability.
YCC Capital's conclusion: China's low-cost AI strategy may pressure global model pricing without displacing America's technological leadership or generating attractive returns for Chinese developers.

The next AI investment battle is shifting from raw intelligence toward intelligence delivered per dollar.
YCC Capital's analysis compares model intelligence scores against weighted task costs on a logarithmic scale.
The dispersion is extraordinary.
OpenAI's GPT-6.1 Sol achieves an intelligence index near 52 at approximately $1 per task.
Google's Gemini 4 Argon scores around 52–53 at approximately $2–$3.
Anthropic's Claude Opus 5.5 reaches roughly 59—but costs nearly $8 per task.
Meanwhile, China's MiMo-V2.6-Pro scores approximately 46 at just $0.16.
That low price demonstrates aggressive competition, not necessarily superior economics.
China's cheaper models remain behind the strongest American frontier systems, while low pricing risks compressing monetization.
YCC Capital's conclusion: The winners will not simply maximize intelligence. They must convert model performance into commercially valuable output at sustainable margins.

The American AI industry is accelerating model releases even as the economics of frontier development become increasingly demanding.
YCC Capital's timeline shows relentless competitive activity from July through October 2026.
OpenAI introduced GPT-5.6 Sol on July 9, followed by subsequent updates and GPT-6 releases.
Anthropic launched Fable 5 on July 1, Opus 5 on July 24, and continued its development cycle through September and October.
Google advanced its Gemini 3.6 and 3.8 families before Gemini 4 Argon reached full release on October 13.
xAI introduced Grok 4.7 in September.
Meta released Muse Wonder in October.
The September 12 and September 29 markers highlight an industry advancing products alongside debates over AI governance.
YCC Capital's conclusion: No major American developer can comfortably slow down. Competitive pressure forces continued spending, even when sustainable returns remain uncertain.

AI infrastructure has become one of America's rare bipartisan points of resistance.
YCC Capital's analysis of U.S. public attitudes reveals overwhelming opposition to constructing AI data centers in local communities.
Among Democrats:
76% oppose construction.
Only 7% support it.
17% remain neutral.
Among Independents:
67% oppose.
5% support.
27% remain neutral.
Among Republicans:
52% oppose.
18% support.
30% remain neutral.
Republicans are considerably more supportive than Democrats, but opposition still commands a majority across every political group.
This creates a structural challenge for U.S. AI expansion.
Even politically popular investments can encounter local resistance when electricity bills, water resources, and land use become contentious.
YCC Capital's conclusion: AI infrastructure is strategically important nationally but politically unpopular locally. Permitting, community acceptance, and grid access are becoming material investment risks.

America's AI expansion faces a political obstacle that money alone cannot solve: local voters.
A nationwide U.S. survey of 1,000 respondents in August 2026 reveals extraordinary resistance to AI data-center construction.
65% oppose projects in their communities.
Only 11% support them.
Another 24% remain neutral.
That's nearly six opponents for every supporter.
This matters enormously for America's AI infrastructure cycle.
Data Center Watch estimated that local opposition delayed or blocked approximately 45 U.S. projects during Q2 2026, representing roughly $68 billion in proposed investment.
Residents are increasingly concerned about electricity prices, water consumption, environmental effects, and neighborhood disruption.
YCC Capital's conclusion: America's greatest AI infrastructure constraint may not be capital availability or semiconductor supply. It may be the political difficulty of translating national technological ambitions into locally acceptable construction projects.

America's AI computing advantage is evolving from Nvidia dependence into a diversified semiconductor ecosystem. China is struggling to keep pace.
By Q4 2025, global cumulative compute capacity exceeded 20 million H100-equivalent units, approximately eight times Q1 2024 levels.
But the composition matters more than the headline.
Google's proprietary TPUs represented approximately 75.5% of its computing capacity.
Amazon's Trainium processors accounted for roughly 41.7% of its total.
Meanwhile, Microsoft, Meta, Oracle, and CoreWeave continued deploying Nvidia accelerator generations.
China's position is considerably weaker.
Huawei Ascend represented approximately 710,000 H100 equivalents, or 61.3% of Chinese computing capacity.
Nvidia still accounted for 34.8%.
YCC Capital's conclusion: America's semiconductor ecosystem is diversifying. China's remains constrained by export restrictions, domestic fabrication limitations, and costly technological substitution. Scale alone cannot eliminate that disadvantage.

The AI arms race is becoming a battle of computing ownership—and America's technology giants are consolidating their advantage.
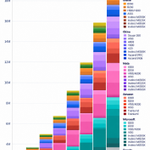
By Q4 2025, five U.S. companies—Google, Microsoft, Amazon, Meta, and Oracle—controlled 70.9% of global cumulative H100-equivalent computing capacity.
China accounted for just 5.7%.
The ownership breakdown reveals a powerful structural shift.
Google's share remained near 23% by late 2025, while Microsoft held approximately 17%, Amazon 12%, and Meta 11%.
The broader market expanded dramatically, but the leading American hyperscalers retained dominant positions.
China's share, meanwhile, declined from approximately 10% in early 2024 to less than 6% by late 2025.
YCC Capital's conclusion: China is losing relative computing influence despite enormous industrial spending. The companies controlling advanced silicon increasingly control AI's economic infrastructure—and its potential future profits.

China's AI semiconductor independence remains far more fragile than Beijing's industrial ambitions suggest.
YCC Capital's breakdown of cumulative computing ownership reveals a critical divergence between the United States and China.
By late 2025, Google increasingly relied on proprietary TPUs, representing 75.5% of its computing capacity.
Amazon's Trainium family contributed approximately 41.7%.
American hyperscalers can diversify across Nvidia accelerators, custom silicon, and successive hardware generations.
China faces a narrower set of alternatives.
Huawei Ascend processors account for 61.3% of Chinese H100-equivalent capacity.
Nvidia still contributes 34.8%.
Cambricon and AMD together represent only 3.9%.
That concentration exposes China's AI ecosystem to manufacturing, software, efficiency, and supply-chain risks.
YCC Capital's conclusion: China may achieve greater domestic chip substitution, but technological self-sufficiency does not automatically mean competitive performance or attractive economic returns.

The global AI computing race is accelerating—and American technology companies control the overwhelming majority of the firepower.
YCC Capital's analysis shows cumulative global AI computing capacity expanding from approximately 2.4 million Nvidia H100-equivalent units in Q1 2024 to more than 20 million by Q4 2025.
That's roughly an eightfold expansion in less than two years.
By year-end 2025:
Google, Microsoft, Amazon, Meta, and Oracle collectively controlled approximately 14.36 million H100 equivalents.
Their combined share: 70.9%.
China controlled approximately 1.16 million equivalents.
Its share: just 5.7%.
Despite China's aggressive data-center construction, its actual computing footprint remains dramatically smaller than America's.
YCC Capital's conclusion: AI leadership is increasingly determined by access to advanced silicon, not construction announcements. America's compute concentration creates an advantage that China's industrial expansion cannot easily replicate.

The global AI industry is not just a software revolution. It's a capital-intensive industrial supply chain.
YCC Capital identifies five interconnected layers determining who captures AI economics:
Semiconductors: Chip design, HBM memory, wafer fabrication, advanced packaging, and accelerators.
Electricity: Generation, transmission, and distribution.
Data centers: Servers, high-speed networks, compute clusters, cooling, and grid connections.
AI models: Training, post-training, and inference deployment.
Applications: Enterprise software, consumer services, and autonomous AI agents.
Every layer depends on the others.
In the United States, even the most advanced GPU generates zero revenue without electricity, cooling, and operational infrastructure.
Meanwhile, China's ability to construct facilities quickly cannot compensate fully for inferior semiconductor access.
YCC Capital's investment thesis: Follow the bottlenecks. Power equipment, advanced chips, and critical infrastructure may capture more durable economics than model developers themselves.

The U.S.–China AI infrastructure gap is enormous. But China's real weakness isn't electricity. It's computing productivity.
YCC Capital estimates that U.S. data-center IT capacity will reach 56GW by year-end 2026, versus China's 24GW+.
The comparison is striking:
🇺🇸 United States: 56GW
China: 24GW+
APAC excluding China: 15GW
Europe, Middle East & Africa: 14GW
Latin America: 2GW
China already operates more capacity than APAC excluding China and Latin America combined.
Yet physical infrastructure is not equivalent to competitive computing power.
China's semiconductor restrictions, dependence on less advanced processors, and costly domestic substitutes threaten utilization and investment returns.
America faces electricity bottlenecks. China faces a more fundamental technological constraint.
YCC Capital's conclusion: Building gigawatts is relatively easy. Converting them into profitable AI computing is the real competitive advantage.

🚨 WALL STREET IS REPRICING THE FED—AND THE RATE PATH IS TURNING MORE HAWKISH.
CME market-implied rate expectations shifted noticeably between October 14 and October 15.
Across the 2026–2027 meeting horizon, implied policy-rate levels rise from approximately 395 basis points to the 470–475 basis-point range.
The October 15 curve sits above the previous day's pricing across most near-term and intermediate maturities.
The most striking adjustment occurs around late 2027, where the earlier curve's sharp decline toward 430 basis points disappears.
Instead, updated pricing remains near 475 basis points.
That is a roughly 45-basis-point repricing at that point on the curve.
YCC Capital interprets this as a warning that investors are reassessing the persistence of restrictive U.S. monetary policy.
Higher expected rates threaten long-duration equities, borrowing-sensitive sectors, and leveraged balance sheets—even before the Federal Reserve makes its next decision.

🚨 THE FED'S OCTOBER OUTLOOK HAS SHIFTED—AND MARKETS ARE NO LONGER COMFORTABLE.
CME FedWatch probabilities reveal a significant repricing of America's monetary policy outlook.
For October 28, markets assign:
60.7% probability to the 375–400 basis-point range.
39.3% probability to the 400–425 basis-point range.
By December 9, the distribution shifts:
7.2% at 375–400 basis points.
58.1% at 400–425.
34.6% at 425–450.
The upward shift continues into 2027.
By December 2027, the highest individual probability is 30.1% for the 450–475 basis-point range, followed by 28.0% for 475–500.
YCC Capital sees a clear message: markets are assigning meaningful probability to a higher policy-rate trajectory.
With U.S. inflation accelerating to 3.7% and energy costs surging, the Fed's flexibility is shrinking.
Investors should prepare for persistent rate uncertainty—not an automatic return to easy money.

🚨 U.S. USED-CAR PRICES ARE STABILIZING—BUT THE NEXT INFLATION RISK IS EMERGING.
America's used-vehicle market has experienced one of the most dramatic inflation cycles in recent history.
Wholesale used-car inflation surged above 50% in 2021, while official used-vehicle CPI subsequently increased more than 40%.
Both measures then collapsed into double-digit deflation during 2023–2024.
Today, the market has largely normalized.
The Manheim Used Car Price Index is fluctuating around zero annual growth, while official used-car inflation remains approximately -1.5% YoY.
But September delivered an important warning: used-vehicle prices increased 0.7% month over month.
Wholesale inventory turnover also tightened from 28.7 to 28.2 days.
YCC Capital interprets this as an early supply-side warning rather than definitive evidence of renewed demand strength.
With wholesale prices historically leading consumer prices by roughly two months, the used-car market deserves renewed attention as U.S. goods inflation begins to reaccelerate.

🚨 AMERICAN GASOLINE PRICES ARE SURGING—AND HOUSEHOLDS ARE PAYING THE PRICE.
The relationship between international crude oil and U.S. gasoline prices has turned decisively inflationary.
At the beginning of 2026, WTI traded near $60 per barrel, Brent hovered around $63, and American gasoline averaged approximately $3 per gallon.
By October, WTI had approached $100, Brent exceeded $105, and gasoline prices climbed toward $4.50 per gallon.
That represents an approximately 50% increase in gasoline prices from their early-year lows.
September's CPI confirms the transmission:
Gasoline: +9.1% MoM.
Gasoline inflation: +34.2% YoY.
Headline CPI: +3.7% YoY.
YCC Capital expects elevated fuel costs to squeeze household discretionary spending while raising freight, aviation, and distribution expenses.
The danger is a simultaneous hit to purchasing power and corporate margins—an increasingly difficult combination for U.S. equities.

🚨 OIL HAS EXPLODED ABOVE $100—AND AMERICA'S INFLATION OUTLOOK IS DETERIORATING.
Global crude markets have undergone a dramatic reversal.
Brent traded near $60 per barrel in early 2026 before surging above $120 during the spring energy shock.
After retreating toward $70 in July, prices have rebounded sharply.
Brent is now approximately $107–108, while WTI trades near $98–100.
That represents roughly a 50% increase from July's lows.
The Brent-WTI spread has widened to approximately $8–10, underscoring international supply pressures.
YCC Capital sees persistent geopolitical disruption and depleted emergency buffers as major risks.
Global oil inventories have fallen approximately 509 million barrels relative to pre-conflict levels, while emergency reserve releases have already reached roughly 330 million barrels.
Oil above $100 threatens inflation, corporate profitability, consumer spending, and the Federal Reserve's policy flexibility simultaneously.

🚨 AMERICA'S RENT INFLATION IS LOSING MOMENTUM—BUT A 2% BREAKTHROUGH IS FAR FROM GUARANTEED.
The relationship between Zillow's Observed Rent Index and official U.S. rent CPI offers a powerful forward-looking signal.
During the pandemic rental boom, Zillow's annual rent growth approached 15%, while official primary residence rent inflation subsequently climbed toward 9%.
The historical transmission lag is approximately 13 months.
Today, Zillow's rent growth has cooled toward 1%, while official primary residence rent inflation has moderated to 2.8%.
That is meaningful progress.
However, the leading indicator has stabilized near positive territory rather than signaling outright rental deflation.
YCC Capital believes this distinction matters enormously.
Shelter represents 35.3% of America's CPI basket, meaning even modest rental inflation can materially influence headline inflation.
The easiest phase of rent disinflation may already be behind us—just as energy prices are accelerating again.
