Drill Down Visuals for #PowerBI and JavaScript Charts Library for #DataExploration
Europe
Joined February 2014
- Tweets1.2K
- Following2.6K
- Followers1.5K
- Likes3K
New article “10 Power BI CRM Dashboard Designs” featuring a CRM pipeline analysis dashboard with sales KPIs, charts, a funnel, and a map.
zoomcharts.com/en/microsoft-…
Explore 12 real Power BI sales dashboards for revenue, profit, targets, customers, conversion, e-commerce, and returns, with interactive templates.
zoomcharts.com/en/microsoft-…
Drill Down Scatter PRO and Drill Down Bubble PRO can now calculate and display separate regression lines for legend groups in addition to an overall regression line.
Try out Bubble PRO in Power BI: marketplace.microsoft.com/ro…
Our unique Donut visual for Power BI now supports a dedicated legend for change indicators.
Change indicators provide context by showing how a category’s value compares with its reference value.
Try Drill Down Donut PRO: marketplace.microsoft.com/en…
In our Graph visual for Power BI you can hide several selected nodes in one action.
Now you can select several nodes and hide them together. Try out Drill Down Graph PRO: marketplace.microsoft.com/en…
#PowerBIVisuals
ZoomCharts visuals update:
Series Labels - make line and area charts easier to read.
This is useful when several lines are close together. Instead of repeatedly checking the legend and matching colors, report users can see the series name next to the data itself. #PowerBIUpdate
Creative Power BI dashboards for PMO portfolio analytics.
Explore all submissions to the FP20 Analytics & ZoomCharts Challenge 41 👇
zoomcharts.com/en/microsoft-…

ALT Promotional graphic for the FP20 Analytics & ZoomCharts Challenge 41, featuring 25 Power BI dashboards focused on PMO Project Portfolio Data Analytics. The purple background displays ZoomCharts and FP20 logos above overlapping dashboard previews showcasing project performance, portfolio health, delivery risks, KPIs, and interactive data visualizations.
October Product Update: Series Labels, Guided Setup, Multiple Node Hiding and Regression Lines by Legend:
zoomcharts.com/en/microsoft-…
Use these Power BI examples to find dashboard design ideas, compare industry-specific KPIs, and see how drill-down charts help turn an overview into practical analysis:
zoomcharts.com/en/microsoft-…
ZoomCharts retweeted
Explore real Power BI finance dashboard examples for financial analysis, budget tracking, executive KPIs, and profitability: zoomcharts.com/en/microsoft-…
Looking for ideas for your next Power BI finance dashboard? These 8 real reports show how to turn financial data into clear, useful dashboards.
linkedin.com/pulse/8-power-b…
Free Power BI Workshop is LIVE now: youtube.com/live/8hA-qkVESh8…
'How to Build a Software Delivery Dashboard in Power BI'
Building an HR dashboard in Power BI?
We’ve gathered 10 real Power BI dashboard examples that tackle key HR questions, from workforce planning and attrition to recruitment, compensation, performance, and workload.
zoomcharts.com/en/microsoft-…
New Article: Explore 10 Best Power BI CRM Dashboard Examples and Templates in 2026: linkedin.com/pulse/10-best-p…
#CRM #PowerBIDashboards
A new Power BI dashboard example is LIVE in the Template Gallery! 🚀
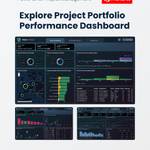
Explore the Project Portfolio Performance Dashboard to track portfolio health, costs, benefits, and individual project performance.
🔗 zoomcharts.com/en/microsoft-…
New in Template Gallery! You can now browse Power BI report examples by popular use case, including Project Management, Sales, Accounting & Finance, HR, KPI, Banking, and Logistics.
Check out the new category pages: zoomcharts.com/en/microsoft-…
ZoomCharts retweeted
Just shipped a Power BI e-commerce profitability dashboard for the @ZoomCharts Challenge. Here's what it took to get it right (not just the charts) 👇
1. The brief: 9,000+ order-line records, 2024–2025. Question wasn't "what did we sell", it was "after discounts, returns,
🧵
Great to see interactive Power BI dashboards for business analytics built with ZoomCharts Drill Down PRO visuals. Thanks for showcasing your work!
🚀 𝐄𝐱𝐜𝐢𝐭𝐞𝐝 𝐭𝐨 𝐬𝐡𝐚𝐫𝐞 𝐦𝐲 𝐬𝐮𝐛𝐦𝐢𝐬𝐬𝐢𝐨𝐧 𝐟𝐨𝐫 𝐭𝐡𝐞 𝐙𝐨𝐨𝐦𝐂𝐡𝐚𝐫𝐭𝐬 𝟒𝐔 𝐑𝐞𝐩𝐨𝐫𝐭𝐬 𝐒𝐞𝐩𝐭𝐞𝐦𝐛𝐞𝐫 𝟐𝟎𝟐𝟔 𝐂𝐡𝐚𝐥𝐥𝐞𝐧𝐠𝐞: 𝐚 𝟒-𝐩𝐚𝐠𝐞 𝐄-𝐂𝐨𝐦𝐦𝐞𝐫𝐜𝐞 𝐏𝐫𝐨𝐟𝐢𝐭𝐚𝐛𝐢𝐥𝐢𝐭𝐲 𝐑𝐞𝐩𝐨𝐫𝐭 𝐛𝐮𝐢𝐥𝐭 𝐢𝐧 𝐏𝐨𝐰𝐞𝐫 𝐁𝐈!
When analyzing e-commerce performance, looking at top-line revenue isn't enough—you need to understand where margins are leaking, from return losses to shipping overhead.
This report breaks down end-to-end operational health across four core areas:
📊 Page 1: Executive Overview – High-level revenue, gross profit, and channel-level return dynamics
👤 Page 2: Customer & Cohort Economics – LTV, retention patterns, ARPU, and segment profitability
📦 Page 3: Product & Inventory Profitability – SKU margin erosion, discount degradation, and stock risks
🚚 Page 4: Operations & Fulfillment Efficiency – Carrier SLA compliance, delivery speed, and fulfillment leakage
A huge thank you to @ZoomCharts for providing tools that make deep interactive drill-downs and smooth visual navigation so effortless.
🔗 Explore the interactive report here:shorturl.at/y1dKK
𝐖𝐨𝐮𝐥𝐝 𝐥𝐨𝐯𝐞 𝐭𝐨 𝐡𝐞𝐚𝐫 𝐲𝐨𝐮𝐫 𝐭𝐡𝐨𝐮𝐠𝐡𝐭𝐬 𝐚𝐧𝐝 𝐟𝐞𝐞𝐝𝐛𝐚𝐜𝐤 𝐢𝐧 𝐭𝐡𝐞 𝐜𝐨𝐦𝐦𝐞𝐧𝐭𝐬! 👇
#4UReport #builtwithzoomcharts #PowerBI #DataAnalytics #BusinessIntelligence #EcommerceAnalytics #DataVisualization
ZoomCharts retweeted
More sales don’t always mean more value.
This report for @ZoomCharts uncovers where profitability is won or lost - from discounts & promotions to returns & fulfillment
Plus, test different growth scenarios to see what happens to the bottom line: shorturl.at/BhZt4