Where structure, liquidity & human error converge. Est. ’16 @AlienTradingLab | Premium Discord ↓

Outlier
Joined March 2022
just do it. $btc
35
37
2
301
120,080
Get through FOMC in one piece. What comes after will pay for every boring hour you waited.
1
11
1,002
$BTC +2.3K off 79.2K while OI drops 8K. Short covering or real demand? Spot CVD +4.9K BTC says there's real demand in it too.
5
3
31
2,845
Said spot leads, it holds. $BTC spot is finally leading. +1.7K BTC off the CVD low, higher lows since 79.2K. OI spiked to 277.7K and is already fading.
9
2
41
3,849
$SOL update: tagged the STH at 125 and rejected. Step one, done. 101-84 can give us the bounce. One more leg down, and the grey zone is where I look for the reversal. Still not getting ahead of the chart.
$SOL HTF outlook: A rejection at the STH followed by a rotation back into the grey zone remains my base case. For bullish continuation, the marked TS low needs to hold. Until the red-marked high is reclaimed, there is no reason to get ahead of the chart.
5
47
5,190
3 months of +5%: $10,000 becomes $11,576. Then one loss stings. You size up 5x to win it back. Three trades, three stops. $9,925. 3 good months. 1 bad afternoon.
1
15
2,888
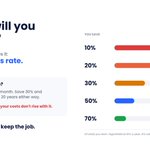
Your income doesn't decide when you're free. Your savings rate does. Save 10%: free in 33 years. Save 30%: 20 years. Save 50%: 13 years. Spend the raise, keep the job.
2
9
3,023
Trader A makes +2% every month. Trader B makes +20%, then −15%, on repeat. B averages more. A ends the year with $12,682. B with $11,262. Average returns lie. Smooth beats exciting.
2
18
3,068
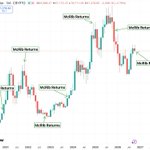
Fixed the $BTC McRib chart everyone's posting. 4 of the 8 returns were missing. One was the 2021 top. One kicked off the 2025 crash. Great sandwich. Terrible indicator.
5
3
57
5,748
Said the $BTC push needed spot. It didn't come, price gave back 3.3K. Now spot is ticking up, OI easing. Spot leads, it holds. OI leads, another flush.
3
36
3,626
10% a year vs 20% a year. Sounds like twice as good. Over 20 years it's x6.7 vs x38. Almost 6x the result. 72 ÷ your yearly return = years to double. Small edge, long time, huge gap.
2
19
3,361
Lose 10%, you need +11% to get back. Lose 50%, you need +100%. Lose 75%, you need +300%. The deeper the hole, the harder the climb. Cut losses early. Math doesn't care about your conviction.
4
4
32
3,093
Higher timeframe: where are we going? Lower timeframe: how are we getting there? Most "you were wrong" replies I get are just answers to the wrong question.
2
23
3,149
Wrong question, remember? $BTC didn't wait for the dip. 92K is still the draw.
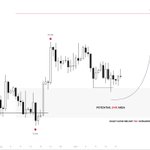
Everyone's asking if $BTC dips into the SMR area first or goes straight from here. Wrong question. On my map, 92K is the HTF draw either way. Daily close below 76K and I'm wrong. Until then, I'm watching one level.
1
37
3,456
Finally. Starting with the chart below, I assume.
JUST IN: 🇺🇸 President Trump to announce crackdown on crypto scams targeting Americans.
4
2
53
3,882
$BTC: same direction, different fuel. Last leg: spot bought back the entire drop. This leg: OI +7.3K BTC, spot flat. Leverage-led pushes can run. They just need spot back to hold.
2
27
3,171
If your income stopped tomorrow, how long would you last? Savings ÷ monthly costs. 5 months is a job. 5 years is a choice. 300 months is freedom. Count yours. Be honest.
1
19
2,878
$BTC: spot just bought back all 5.5K BTC it sold in the drop. Funding cooled from 0.01 to 0.0037 while price pushed. OI still at 268K. Same leverage. Healthier push.
1
47
3,328
GM.☕️ Your salary pays your bills. Your savings buy your options. Too many people work 40 years and never buy a single one.
3
30
3,276
Your income doesn't decide when you're free. Your savings rate does. Save 10%: free in 33 years. Save 30%: 20 years. Save 50%: 13 years. Spend the raise, keep the job.
1
1
17
3,524
Everyone's asking if $BTC dips into the SMR area first or goes straight from here. Wrong question. On my map, 92K is the HTF draw either way. Daily close below 76K and I'm wrong. Until then, I'm watching one level.
10
2
1
93
8,494