

Data & BI Analyst | Beloved ☦️ | Chelsea 💙 AI-maxxing
Nigeria
Joined June 2026
- Tweets964
- Following97
- Followers77
- Likes1.4K






Pinned Tweet
🚀 It's finally COMPLETE!
I've officially finished my Sunrise Coffee Chain Performance Analysis (2023–2024).
What caught my attention: transactions increased by 16.86%, while revenue and net profit both declined.
The data had a story to tell. 🧵👇
github.com/Cephasia
👇👇


Opeyemi retweeted
Nice 🎉
Just get in touch with the CEO/Founder of @InfinityLearnMu
India, let's go 🇮🇳
"With Data, We Move!"

Nice 🎉
Just get in touch with the CEO/Founder of @InfinityLearnMu
India, let's go 🇮🇳
"With Data, We Move!"
Opeyemi retweeted
Learn!
Learn!
Learn!
Have a Portfolio!
Have a Portfolio!
Have a Portfolio!
Have a Portfolio!
Have a Portfolio!
Have a Portfolio!
Have a Portfolio!
Have a Portfolio!
Have a Portfolio!
cephasia.github.io
My portfolio just got retouched🥳
You can now explore what I do or have done beyond analytics 🌝
Light mode fixed, becoming more professional
I will love to hear from seniors, developers, analyst, AI-maxxers, cause building this is not quite easy for me as a non-developer👇


Learn!
Learn!
Learn!
Have a Portfolio!
Have a Portfolio!
Have a Portfolio!
Have a Portfolio!
Have a Portfolio!
Have a Portfolio!
Have a Portfolio!
Have a Portfolio!
Have a Portfolio!
cephasia.github.io
Opeyemi retweeted
My portfolio just got retouched🥳
You can now explore what I do or have done beyond analytics 🌝
Light mode fixed, becoming more professional
I will love to hear from seniors, developers, analyst, AI-maxxers, cause building this is not quite easy for me as a non-developer👇
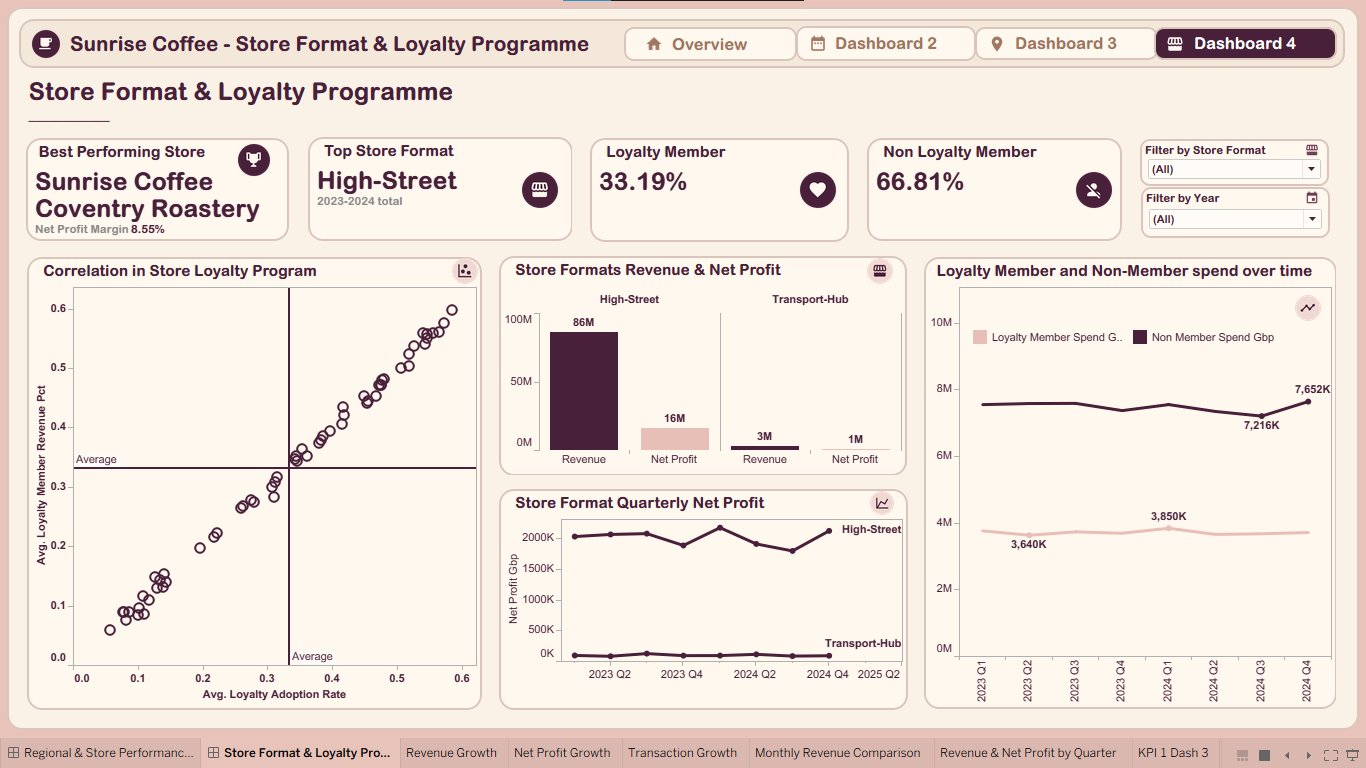
The project explores the business performance of Sunrise Coffee Chain across 60 stores between 2023 and 2024
The dataset covers daily sales and monthly profitability, supported by information about stores, products, regions.......
See datadna.onyxdata.co.uk/chall…

Check it out and give you comments... Well constructed criticism is allowed 😐
cephasia.github.io

Thanks for reposting ☺️
The completed project includes multiple Tableau dashboards, year-over-year comparisons, an executive summary, business recommendations...
I wanted the analysis to communicate a business story
Explore: github.com/Cephasia
Feedback is welcome! 🙌

Opeyemi retweeted
🚀 It's finally COMPLETE!
I've officially finished my Sunrise Coffee Chain Performance Analysis (2023–2024).
What caught my attention: transactions increased by 16.86%, while revenue and net profit both declined.
The data had a story to tell. 🧵👇
github.com/Cephasia
👇👇
Opeyemi retweeted

Scalar Subqueries in the SELECT Clause
A scalar subquery is a subquery that returns exactly one value: one row and one column. You can use it inside the SELECT clause to calculate or retrieve a value for each row returned by the outer query.
Unlike a regular subquery that might return multiple rows, a scalar subquery must produce a single value whenever it is evaluated.
A full SQL course is available on YouTube:
youtu.be/7OIch467ebc?si=jmlZ…
☕ Where was the revenue coming from? 🤔
Espresso contributed 47.47%, while Food contributed 25.27%.
Together, they accounted for 72.74% of revenue.
Understanding product mix can reveal opportunities that total revenue figures alone might hide.
#DataAnalytics
Those that have been with me will know that a lot of edit have been made to the project compare to the first version
Including change a in title 😕
📊 More transactions didn't mean more money.
Transactions grew by 16.86%, but revenue declined by 0.62% and net profit by 0.79%.
This raised an important question: was the business attracting more transactions but generating less value per transaction?
Analysis continues......


Opeyemi retweeted

I just built a 5-page interactive Car Insurance Analytics Dashboard in Power BI analyzing 37,542 policyholder records to uncover claim patterns, risk drivers, and customer behavior.
Here's what I found 👇 – at Ijede, Nigeria


Insurance dashboard update
Today I moved from the cleaning phase to building!
Here's what I did:
✅ Wrote my DAX measures — Total Policyholders, Claim Penetration %, Total Claim Amount, Avg Claim & more
✅ Started building the Executive Summary page
✅ Began designing the dashboard layout in PowerPoint
✅ KPI cards and charts are taking shape
Working with 37,542 rows of Insurance Policyholder data and the numbers are already telling a story.
More pages coming this week
#PowerBI #DataAnalytics #DAX #DashboardDesign


