Insights, charts and data to create shared knowledge and expand our understanding of India.

India
Joined January 2023
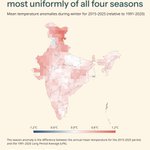
Climate across India is influenced by factors such as latitude, elevation, land use, proximity to the coast and atmospheric circulation. These geographical differences mean that warming affects different seasons and regions differently. Using daily gridded temperature data from the India Meteorological Department (IMD), we analyse mean temperature anomalies across India for the 2015-2025 period relative to the 1991-2020 climatological baseline. Since temperatures naturally vary across India, anomalies offer a more consistent way to compare warming across regions and over time. Negative anomalies (shown in blue) indicate temperatures cooler than the baseline average, while positive anomalies (shown in red) indicate warmer-than-baseline conditions. Winter in India shows the most geographically widespread warming of all four seasons, with positive anomalies across almost the entire country. This means that our winters are becoming warmer, and nearly all states show temperatures above the 1991-2020 average. Warming is strongest in north-western India. Parts of Rajasthan, Gujarat, Punjab, Haryana, Himachal Pradesh, Jammu and Kashmir, and Ladakh show anomalies exceeding +0.5°C, locally approaching +1.1°C. The central and southern states, including Maharashtra, Telangana, Andhra Pradesh, Karnataka, Tamil Nadu and Kerala, show smaller increases of around +0.2°C to +0.5°C. Warmer winter conditions have important implications for rabi agriculture, which is particularly sensitive to rising temperatures. They can also increase crop water stress and alter irrigation requirements. #Heat #GlobalWarming #Winter #Temperature #India #DataForIndia
1
4
12
745
New Data Byte: Tobacco usage in India is highest among older people, by @nileena_suresh About one in four Indians over the age of 15 reported smoking or using some form of tobacco as of 2021, according to the National Family Health Survey 2019-21. However, there is a significant divide in tobacco consumption between younger and older adults. Across the population, over one in three Indians in their 40s and 50s consume tobacco, compared to just half that share among those in their 20s. The gap is particularly striking among men. Over half of Indian men in their 30s and 40s consume tobacco, whereas the share is just over a quarter among men in their 20s. Tobacco consumption is much less common among women. Overall, just 4% of women consume tobacco in some form. However, even among women, prevalence increases with age, reaching about 17% among women aged 50 and above. Tobacco is consumed in many forms, the most common being paan masala or gutkha, followed by cigarettes, khaini and bidis. Across age groups, chewing tobacco like gutkha, paan masala and khaini is more common than smoking. About two-thirds of tobacco users consume these products, while around half smoke bidis or cigarettes. Regardless of the form, tobacco has serious health consequences and is a major risk factor for serious non-communicable diseases, like cancers, heart disease and respiratory illnesses. This generational gap is observed globally. Across most countries, younger people are less likely to use tobacco than their older counterparts. #Tobacco #Gutkha #Health #India #DataForIndia
1
1
9
816
Data Bytes brings you one chart about India every week, and the story behind the data. Subscribe to receive the next Data Byte, right in your inbox. dataforindia.com/data-bytes/…
136
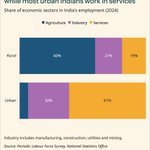
India has the world’s second-largest labour market, with approximately 625 million workers. One way to understand this labour market is to examine how workers are distributed across three major sectors: agriculture, industry and services. Agriculture employs nearly half of India’s workforce, while industry and services each employ roughly a quarter. Where Indians work has changed significantly over the past 50 years. Agriculture’s share of employment has fallen from three-quarters in the 1970s to less than half in 2024. This change is in line with the economic transformation that is expected when a developing country grows and industrialises. Those who moved out of agriculture entered industry and the services sector. Industry includes construction and manufacturing, in addition to public utilities and mining. Within industry, construction now employs 75 million people, more than the 65 million workers who are in manufacturing. Services mainly include trade, transport, communications, real estate, financial services, professional services, and public administration. In the services sector, trade and hotels have gained the most and now employ 70 million people. #Work #Employment #Job #India #DataForIndia
1
8
1
24
881
There has been a significant expansion in access to electricity for Indian households over the last three decades. Access is now widespread across the country, with most states having provided electricity to over 95% of households. However, having an electricity connection doesn't guarantee reliable service. Households can still face challenges with frequent power cuts, voltage fluctuations and inconsistent supply. To understand how many Indian households are using electricity regularly, we look at data from the Household Consumption Expenditure Surveys, which ask households about their primary energy source for lighting. In 1983, more than eight in ten rural households primarily used kerosene to light their homes. That share was down to virtually zero by 2024. Electricity lights most Indian homes now. The households who do not yet use electricity are concentrated in India’s poorest communities. Over one in six of the poorest rural households did not have access to electricity as of 2021. #Electricity #Power #Lighting #India #DataForIndia
4
8
1
23
1,252
New Data Byte: 2025 saw the most intense pre-monsoon rainfall in India, by Juhi Chatterjee While the majority of India's rain falls during its south-west monsoon, the pre-monsoon season (March-May) also accounts for a share of the precipitation. The 2025 pre-monsoon season in India stands out as one of the most extreme on record. Three key rainfall indicators-total precipitation, maximum one-day rainfall, and maximum five-day rainfall-capture the severity of short-duration rainfall events. Total precipitation is the cumulative rainfall received during the pre-monsoon season. Maximum one-day rainfall represents the highest rainfall recorded in a single day during the season. Maximum five-day rainfall measures the highest rainfall accumulated over any consecutive five-day period. In 2025, the maximum one-day and maximum five-day rainfall both recorded their highest values since 1951. Together with the near-record total seasonal precipitation, these indicators suggest that pre-monsoon rainfall is becoming both heavier and more concentrated during heavy spells. All three indicators show an upward trajectory over the past seven decades, with the sharpest increases occurring after 2015. Historically, the pre-monsoon was relatively drier, averaging just 10-15 rainy days and 20-50 mm of cumulative rain at the national level. Recently, however, both rainfall frequency and totals have increased, with 2025 recording seasonal precipitation of 126 mm - the second-highest value since 1951. The increasing concentration of rainfall into one-day and multi-day events has important implications for disaster risk, agriculture and urban infrastructure. #Monsoon #Rain #Climate #India #DataForIndia
2
13
658
Data Bytes brings you one chart about India every week, and the story behind the data. Subscribe to receive the next Data Byte, right in your inbox. dataforindia.com/data-bytes/…
171
The full extent of people's interactions with the law in India can be difficult to quantify. We analysed cases disposed of across India’s subordinate courts between 2010 and 2020. These cases, heard before magistrates, civil judges, and district and sessions judges, are the first point of contact between Indians and the legal system. In all, this dataset contains 43 million records of legislation invoked in cases. While criminal cases contribute to the majority of the dataset, the data also provides valuable insights into civil litigation, which is otherwise rarely captured in Indian data. Civil statutes define people’s rights and obligations in personal or contractual relationships, and provide remedies when disputes arise. The top five civil statutes invoked in the ten-year period were the civil provisions of the Motor Vehicles Act of 1988, the Hindu Marriage Act of 1955, the Registration of Births and Deaths Act of 1969, the Protection of Women from Domestic Violence Act of 2005, and the Arbitration and Conciliation Act of 1996. The civil provisions of the Motor Vehicles Act are the most commonly invoked, with 1.75 million records. They cover claims over loss of life or property, vehicle damage and insurance liability. Section 166, which allows people to seek compensation after an accident, was cited 1.25 million times. The Hindu Marriage Act follows with 1.34 million records. It covers marriage, divorce and separation among Hindus, with contested divorce cited most often, followed by divorce by mutual consent. #CriminalLaw #Legal #Law #India #DataForIndia
2
7
2
24
2,538
Childhood vaccinations are a cornerstone of India’s public health programme, playing an essential role in reducing infant mortality in the country. India provides free immunisation against 12 vaccine-preventable diseases under its Universal Immunization Programme (UIP), including poliomyelitis, tuberculosis, rotavirus diarrhoea and measles. Vaccination coverage has improved sharply over time, especially in rural India. In 1993, fewer than one in three rural children were fully vaccinated. By 2021, this had increased to over three in four children in both rural and urban India. ‘Zero-dose children’ is a term used as a measure of the lack of access to routine immunisation services, and is defined by the World Health Organization (WHO) as children who have not received the first dose of the DPT vaccine. The share of zero-dose children in India has dropped to just 7%, as of 2021. Despite national gains, there are large differences between states. In 2021, Odisha had the highest share of fully vaccinated children, with coverage well above the national average. Other states where close to nine in ten children are fully vaccinated include West Bengal, Jammu and Kashmir, Himachal Pradesh and Tamil Nadu. In contrast, several north-eastern states record some of the lowest vaccination coverage in the country. #Immunisation #PublicHealth #Health #India #DataForIndia
1
3
1
23
935
New Data Byte: North-eastern states have the highest shares of workers in government jobs, by @akwaghmare Jobs in the public sector remain among the most sought after in India. The public sector is made up of various departments and arms of the government, including companies run directly by the government. Jobs in the public sector are more secure with greater employment benefits than in the private sector. Yet the public sector can only offer a minority of Indian adults jobs. Just 6% of workers in India are in the public sector. Another 6% of workers are in private companies. The majority of India's workers, meanwhile, are employed in household enterprises. This data comes from the 2023-24 round of India's annual Periodic Labour Force Survey, a nationally representative labour survey conducted by the National Statistics Office. The share of the workforce in government jobs is highest in India's north-east, where the private sector remains small. One in four jobs in Mizoram, Nagaland and Sikkim are in the public sector. The share of public sector jobs is also high In India's richer and better educated southern states, including Kerala and Tamil Nadu, where between 10% and 15% of the workforce is in the public sector. The share of the workforce in public sector jobs is lowest in India's poorest regions with the lowest levels of education, including large parts of central and northern India. Only 3% of workers in Bihar, Madhya Pradesh and Uttar Pradesh are in government jobs, while more than 90% of the workforce there works in household enterprises. #Jobs #GovtJobs #Work #India #DataForIndia
1
1
17
796
Data Bytes brings you one chart about India every week, and the story behind the data. Subscribe to receive the next Data Byte, right in your inbox. dataforindia.com/data-bytes/…
184
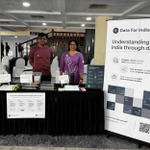
🧵 Data For India was at @IndiaFOSS in Bengaluru this September! Over the two days of the conference, we spoke with over a thousand free and open source software enthusiasts about our work and making public data easier to understand and use. At our booth, @nileena_suresh and @TheDataAreClean guided visitors through hands-on activities, inviting them to make guesses about India and compare their answers with the data. The responses opened up many conversations about the gap between data being publicly available and being useful to people. #FOSS #OpenSource #DataForIndia
1
3
31
1,279
Our founder, @Rukmini, also spoke at the conference on “Telling India’s Story Through Data”. She explored why easier access to data needs to go hand in hand with context, so it can help people understand the country and make better decisions. Thank you to everyone who stopped by, joined the activities, and shared their questions and ideas. And thank you to @FOSSUnited for bringing us together.
1
1
227
Higher education is often seen as a pathway to better job prospects and wages. The share of graduates in India remains quite low, with fewer than 15% of Indians aged 25 and above, or only 140 million people, holding a graduate degree. Among these graduates, unemployment rates are high. Nearly one in seven of India's graduates, or 13%, were unemployed as of 2024. In comparison, the unemployment rate is nearly zero among the illiterate population. Among graduates, the unemployment rate is the highest among those in their twenties, many of whom are likely to be fresh graduates. More than a third of graduates in their early twenties are unemployed, and 85% of all unemployed graduates are under the age of 30. The unemployment rate falls steadily with age. India's high graduate unemployment rate is similar to some low and middle-income developing economies, but is three to five times higher than in advanced economies like Europe and North America. #Graduates #Work #Employment #Jobs #India #DataForIndia
1
8
1
20
1,069