

Leading data-driven insights & market intelligence across Southern Africa
- Tweets974
- Following72
- Followers763
- Likes953
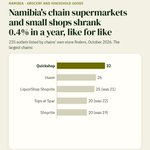




ALT Bar chart: the largest chains, grocery and household goods, Namibia, by outlets: Quickshop 32, Usave 26, LiquorShop Shoprite 25, Tops at Spar 20, Shoprite 20. Source: All The Places (CC0), from brands' own store finders.

ALT Deal card: Explorer Talonx raises $545K to drill Botswana copper, WA gold. Capital markets in Botswana, Announced, 30 Oct 2026. Reported by Dealroom; not yet confirmed by a regulator, exchange or the companies.

ALT Bar chart of account ownership in 14 SADC countries, 2024: Mauritius 89.6%, South Africa 81.1%, Namibia 72.9%, Zambia 72.7%, Eswatini 65.1%, Lesotho 61.6%, Botswana 61.4%, Tanzania 59.8%, Mozambique 54.4%, Malawi 50.4%, Zimbabwe 49.5%, Comoros 45.5%, DRC 39.2%, Madagascar 24.5%. Source: World Bank, World Development Indicators.

ALT In the news: Oil price shocks and inflation risks: evidence from South African market pricing (South African Reserve Bank and Prudential Authority). Bar chart of consumer price inflation across SADC with South Africa picked out: Zimbabwe 104.7%, Malawi 28.4%, Angola 20.2%, Zambia 13.9%, Madagascar 8.1%, Mozambique 4.4%, Lesotho 4.3%, Mauritius 3.7%, Namibia 3.5%, Tanzania 3.3%, Comoros 3.2%, South Africa 3.2%, Botswana 2.7%, Seychelles 0.3%. Source: World Bank, World Development Indicators.

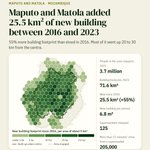
ALT Map of Maputo and Matola in areas of about 5 square kilometres, shaded by building footprint added between 2016 and 2023, with the urban centre outlined. People in the area mapped, 2025: 3.7 million; Building footprint, 2023: 71.6 km²; New since 2016: 25.5 km² (+55%); New building per person: 6.8 m²; Supermarkets mapped: 125; More than 15 minutes' drive from a supermarket: 205,000.

ALT Deal card: MANTENGU: Disposal of Sublime Technologies. M&A in South Africa, Announced, 29 Oct 2026. Source: JSE (SENS announcements).

ALT Deal card: Invictus Investment Enters Into Agreement With Helios Investment Partners for Minority Stake in Merec Industries. Private equity in Mozambique, Announced, 21 Oct 2026. Confirmed by Invictus Investment Company PLC.

ALT Deal card: Tony and Lorato Stegling and Pie City: merger notice. M&A in Botswana, With the regulator, 29 Oct 2026. Source: Competition and Consumer Authority.

ALT Bar chart: grocery and household goods exports by SADC country, 2024: South Africa $5.1bn, Mauritius $630m, Tanzania $627m, Zambia $508m, Eswatini $473m, DRC $358m, Mozambique $267m, Seychelles $244m. Source: CEPII BACI, from UN Comtrade.

ALT The Bank of Botswana's Monetary Policy Committee meets today. Bar chart of lending interest rate across SADC with Botswana picked out: Madagascar 60%, Zimbabwe 46.4%, Malawi 37.1%, DRC 24.1%, Angola 19.4%, Mozambique 17.5%, Lesotho 11.2%, Namibia 11%, Eswatini 10.9%, South Africa 10.7%, Seychelles 9.9%, Mauritius 9%, Comoros 8%, Botswana 6.3%. Source: World Bank, World Development Indicators.

ALT Paired bars for South Africa, 2024: each industry's share of output and of jobs. Agriculture: 3% of output, 5% of jobs; Mining and utilities: 10% of output, 4% of jobs; Manufacturing: 14% of output, 10% of jobs; Construction: 2% of output, 8% of jobs; Trade, restaurants and hotels: 14% of output, 20% of jobs; Transport and communication: 8% of output, 9% of jobs; Finance, property, public and other services: 48% of output, 44% of jobs. Source: UN Statistics Division, national accounts; International Labour Organization, modelled estimates.

ALT Bar chart of imf growth forecast in 16 SADC countries, 2026: Tanzania 6%, Zambia 5.6%, DRC 5.2%, Zimbabwe 5%, Angola 4.4%, Botswana 4.4%, Madagascar 3.8%, Eswatini 3.7%, Comoros 2.9%, Mauritius 2.7%, Malawi 2.6%, Namibia 2%, Lesotho 1.1%, Mozambique 1%, Seychelles 1%, South Africa 1%. Source: IMF, World Economic Outlook.

ALT In the news: Bank of Namibia faces pressure to raise repo rate to 7% (Windhoek Observer). Bar chart of lending interest rate across SADC with Namibia picked out: Madagascar 60%, Zimbabwe 46.4%, Malawi 37.1%, DRC 24.1%, Angola 19.4%, Mozambique 17.5%, Lesotho 11.2%, Namibia 11%, Eswatini 10.9%, South Africa 10.7%, Seychelles 9.9%, Mauritius 9%, Comoros 8%, Botswana 6.3%. Source: World Bank, World Development Indicators.

ALT Deal card: Proposed Acquisition of Libertas General Insurance by Victoria Forex Bureau. M&A in Malawi, Announced, 27 Oct 2026. Source: Competition and Fair Trading Commission.

ALT Deal card: Zimbabwe's US$16.82 Million Pandemic Investment Confronts a Deeper Water Crisis. Private equity in Zimbabwe, Announced, 28 Oct 2026. Reported by Equity Axis; not yet confirmed by a regulator, exchange or the companies.

ALT Bar chart: exports sold to china, 16 SADC countries, 2024: DRC 73%, Angola 40%, Zimbabwe 27%, Namibia 23%, Zambia 22%, Botswana 20%, South Africa 18%, Mozambique 17%, Madagascar 8%, Tanzania 6%, Lesotho 3%, Malawi 2%, Seychelles 1%, Mauritius 1%, Comoros under 1%, Eswatini under 1%. Source: CEPII BACI.

ALT In the news: Tanzania discovers 223 billion cubic feet of natural gas in Mtwara (thecitizen.co.tz). Bar chart: oil, gas and LNG exports by SADC country, 2024: Angola $35.9bn, Mozambique $3.5bn, DRC $599m, South Africa $265m, Tanzania $79m, Eswatini $3m, Madagascar $2m, Mauritius $531k. Source: CEPII BACI, from UN Comtrade.

ALT Map of Lusaka in areas of about 5 square kilometres, shaded by building footprint added between 2016 and 2023, with the urban centre outlined. People in the area mapped, 2025: 4 million; Building footprint, 2023: 86.2 km²; New since 2016: 28.9 km² (+50%); New building per person: 7.2 m²; Supermarkets mapped: 169; More than 15 minutes' drive from a supermarket: 91,000.

ALT Deal card: Acquisition OF Napperby Uranium Resource AND High-Grade Exploration Projects. M&A in Namibia, Announced, 27 Oct 2026. Source: Namibian Stock Exchange.

ALT Deal card: PPC: Successful Disposal of Vacant Land by PPC Zimbabwe (Private). M&A in South Africa, Announced, 27 Oct 2026. Source: JSE (SENS announcements).