

Investor Learner Observer
Joined September 2023
- Tweets29.5K
- Following102
- Followers20.6K
- Likes3.7K
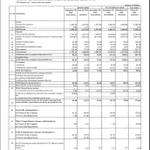
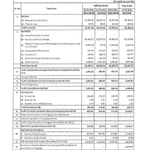


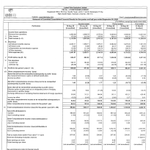
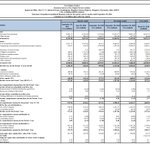

31st Oct 2026 Q2FY27 Results Snapshot:-
#Q2Results #Q2FY27 #Nifty
🚩Decent / Good / Blockbuster👏😃🔥
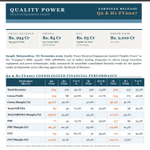
1) Quality Power Electrical Equipments (Solid)(Had guided for 15–20% growth in FY27)(H1FY27 has already delivered 33% revenue growth & 52% growth in both EBITDA & PAT)(With new capacities going live growth is expected to accelerate further)
2) Zen Technologies (Solid)(Comeback quarter)
3) CDSL (Good numbers after 6 Quarters)(CDSL’s demat account base grew by around 17% YoY)
4) Shyam Metalics and Energy (Solid)(Total Sales Volume increased by 26% YoY to 15.49 Lakh Tonnes)(Revenue up by 33.4%)(Operating EBITDA up by 52.6%)(PAT up by 96.2%)
5) Nila Infrastructures (Solid)
6) Pace Digitek (Solid)(Margin Expansion)(FY27 Revenue Guidance raised to ₹3,300–3,500 Cr from the earlier guidance of ₹3,200–3,400 Cr)(FY28 Revenue Guidance ₹4,000–4,200 Cr)
7) Advanced Enzyme Technologies (Good)(Margin Expansion)
8) Menon Pistons (Decent)(Margin up)
9) Nitin Spinners (Solid)(Margin Expansion)
10) GHCL (Soda Ash: Global industry continues to face pricing pressure due to oversupply and steady imports. Soft realisations are expected to persist over the next few quarters)(Looking ahead, our strategic focus remains firmly on operational excellence, optimizing our newly commissioned Vacuum Salt and Bromine capacities, and advancing our long-term greenfield expansion plans)
11) Om Power Transmission (Blockbuster)(Margin Expansion)
12) Innomet Advanced Materials (SME)(Solid)(Revenue up 136.6%)(EBITDA up 93.5%)(PAT up 135.8%)
13) PAKKA (Blockbuster)
14) NTPC (Decent)
15) Technocrats Plasma Systems (SME)(Margin down)(Revenue up 97.3%)(EBITDA up 78%)(PAT up 50.8%)
16) OBSC Perfection (SME)(Decent but Margin down)(Current Order book at 1,200+ Cr)
17) Aditya Birla Lifestyle Brands (Good)(Delivers double digit growth for 4th consecutive quarter, with PAT more than doubling YoY)(Lifestyle brands was up 9%)(Emerging business grew 27% YoY)(Retail L2L for the quarter stood at 5.3% despite shift in festive calendar)
18) Muthoot Finance (AUM up 42%)(PAT up 39%)(Consolidated Gold Loan up 46%)
19) Ganesha Ecosphere (Solid)(Margin Expansion YoY but down QoQ)
20) Panchmahal Steel (Margin Expansion)
21) Sigachi Industries (Decent)(Margin Expansion)
22) Sahyadri Industries (Decent)(Margin Expansion)
23) Gem Aromatics (Margin Expansion)(Revenue growth supported by an improved product mix in Mint and recovery in the Clove business)(Gross & EBITDA margin improved both YoY & QoQ in Q2FY27, driven by the normalisation of Clove margins and a favourable shift towards higher-margin products, particularly within the Mint portfolio)(increasing capacity utilisation is expected to drive operating leverage)(With the Dahej facility in the early stages of ramp-up, depreciation remains relatively elevated in relation to current operating volumes)(Higher capacity utilisation is expected to improve fixed-cost absorption and support profitability)
24) Mahickra Chemicals (SME) (Solid Margin Expansion)
25) Neogen Chemicals (Decent)(Margin Expansion YoY but down QoQ)
26) B-Right Realestate (SME)
27) Jay Jalaram Technologies (SME)(Blockbuster)
28) Priority Jewels
🚩Bad / Poor / Weak 😠😡🤬
1) WPIL
2) Sarda Energy & Minerals
3) Clean Science and Technology (Margin down)
4) Atul Auto (Margin down)(3W Sold up 28.85%)
5) Nucleus Software Exports
6) Mangal Electrical Industries (Margin down)(CRGO volumes increased by 63% YoY)(CRGO realizations are showing signs of normalisation following a prolonged correction in prices)(Company remained selective on orders intake amid intense pricing competition in the distribution transformers, resulting in lower transformer sales during the period)(Ramp up capacity utilization to support sustained 25-30% annual volume growth over the next three years)
7) Birla Corporation (Margin down)
8) Shree Ganesh Remedies
9) Suraj Estate Developers (Margin down)
10) Uttam Sugar Mills (Reduction in finance cost helped PAT growth)
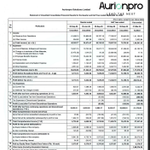
11) Aurionpro Solutions
12) Studds Accessories (Margin down)(Sharp volatility in crude oil prices led to a steep increase in styrene-based raw material costs, impacting profitability)(a sustained recovery in margins will depend on raw material prices stabilizing)(Looking ahead, we remain firmly on course towards our medium-term aspiration of ₹1,000 crore in revenue, with exports contributing 25% to 30%)
13) Unifinz Capital India
14) Corporate Merchant Bankers
15) Latent View Analytics (Margin down)(Also pace of growth rate also slowed down)
🚩Mixed / Neutral / Average🙄🆗😑
1) Captain Polyplast (Margin down)(EBITDA margin for quarter declined 63 BPS YoY primarily due to sharp increase in raw material costs. We expect the margins to stabilize in coming quarters once benchmark prices are revised by the government)
2) Dolphin Offshore Enterprises (Margin down)
3) Eveready Industries India (Margin down)
4) D-Link (India)(Margin down)
5) Mercury Ev-Tech (Revenue down but Solid margin Expansion)
6) LG Balakrishnan & Bros (Margin down)
7) Atlanta Electricals (Track)(Margin down)(Margin pressure came from elevated commodity prices, particularly on certain firm-price contracts)(Temporary production and dispatch disruptions also weighed on profitability)(Weather-related disruptions deferred customer deliveries worth approximately ₹180 Cr during Q2 FY27. Around 70% have since been dispatched, with the remaining deliveries expected to be completed in Q3 FY27)
8) Advit Jewels (Margin down)
9) NSDL (Added 15.6 lakh net BO accounts (17.8 lakh gross), taking total BO account base to 4.72 cr)(Market share in the Unlisted Equity segment stands at 72.5% in Q2 FY27)(As of September 30, 2026, market share by total Demat Custody Value stood at 85.8%, of which market share of individual and HUF stands at 66.3%)
10) Vishnu Chemicals
11) Rainbow Children's Medicare (Inpatient and outpatient volumes remained healthy despite seasonal softness due to significant monsoon shortfall)(Revenue grew by 23% YoY while EBITDA & PAT recorded growth of 14% & 11% respectively)
12) Sacheerome (SME) (Below Avg)
13) Mrugesh Trading (No view)
14) Sera Investments & Finance India (No view)
15) Neueon Corporation (No view)
16) Ashika Global Securities (No view)
Priority Jewels — Q2FY27 Results 🔔
#Q2Results #Q2FY27 #Priority
Revenue ₹183.53 Cr vs ₹157.51 Cr
(+16.52% YoY┃+25.08% QoQ)
EBITDA ₹11.17 Cr vs ₹9.57 Cr
(+16.66% YoY┃+8.50% QoQ)
EBITDA Margin 6.08% vs 6.08% YoY & 7.01% QoQ
PBT ₹8.22 Cr vs ₹7.28 Cr
(+12.91% YoY┃-3.77% QoQ)
PAT ₹6.54 Cr vs ₹5.35 Cr
(+22.21% YoY┃+0.93% QoQ)
PAT After Minority interest ₹6.36 Cr vs ₹5.35 Cr
(+18.85% YoY┃-5.05% QoQ)

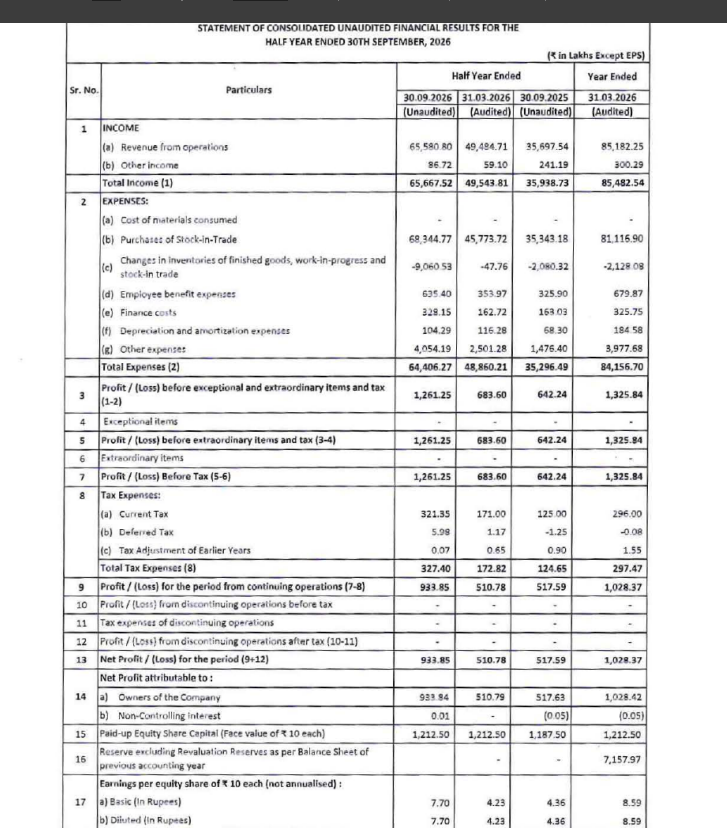
Jay Jalaram Technologies (SME) — H1FY27 Results 🔔
#H1Results #H1FY27 #JayJalaram
H1FY27 vs H1FY26
Revenue ₹655.81 Cr vs ₹356.98 Cr (+83.71% YoY)
EBITDA ₹16.07 Cr vs ₹6.32 Cr (+154.11% YoY)
EBITDA Margin 2.45% vs 1.77% YoY
PBT ₹12.61 Cr vs ₹6.42 Cr (+96.38% YoY)
PAT ₹9.34 Cr vs ₹5.18 Cr (+80.41% YoY)
Other Income ₹0.87 Cr vs ₹2.41 Cr YoY
Mercury Ev-Tech — Q2FY27 Results 🔔
#Q2Results #Q2FY27 #MercuryEV
Revenue ₹30.09 Cr vs ₹34.01 Cr
(-11.51% YoY┃-9.86% QoQ)
EBITDA ₹6.38 Cr vs ₹3.02 Cr
(+111.45% YoY┃+95.59% QoQ)
EBITDA Margin 21.19% vs 8.87% YoY & 9.77% QoQ
PBT ₹2.29 Cr vs ₹2.35 Cr
(-2.69% YoY┃+17.31% QoQ)
PAT ₹1.22 Cr vs ₹1.84 Cr
(-33.99% YoY┃-21.96% QoQ)
PAT After Minority interest ₹1.56 Cr vs ₹1.72 Cr
(-9.48% YoY┃-5.44% QoQ)
Other Income ₹0.18 Cr vs ₹0.64 Cr YoY & ₹0.36 Cr QoQ

B-Right Realestate (SME) — H1FY27 Results 🔔
#H1Results #H1FY27 #bright
H1FY27 vs H1FY26
Revenue ₹141.31 Cr vs ₹54.50 Cr (+159.28% YoY)
EBITDA ₹42.99 Cr vs ₹18.98 Cr (+126.56% YoY)
EBITDA Margin 30.43% vs 34.82% YoY
PBT ₹38.41 Cr vs ₹18.84 Cr (+103.91% YoY)
PAT ₹25.91 Cr vs ₹12.16 Cr (+113.06% YoY)
PAT After Minority interest ₹9.25 Cr vs ₹3.56 Cr (+159.85% YoY)
Other Income ₹2.59 Cr vs ₹1.65 Cr YoY

Latent View Analytics — Q2FY27 Results 🔔
#Q2Results #Q2FY27 #Latentview
Revenue ₹294.07 Cr vs ₹257.54 Cr
(+14.18% YoY┃+2.51% QoQ)
EBITDA ₹59.77 Cr vs ₹56.14 Cr
(+6.47% YoY┃+5.45% QoQ)
EBITDA Margin 20.32% vs 21.80% YoY & 19.76% QoQ
PBT ₹65.41 Cr vs ₹61.71 Cr
(+5.98% YoY┃+0.18% QoQ)
PAT ₹48.47 Cr vs ₹45.73 Cr
(+5.99% YoY┃+2.90% QoQ)
PAT After Minority interest ₹48.61 Cr vs ₹44.39 Cr
(+9.49% YoY┃+1.00% QoQ)
Other Income ₹17.53 Cr vs ₹18.59 Cr YoY & ₹21.29 Cr QoQ

Pace Digitek — Q2FY27 Results 🔔
#Q2Results #Q2FY27 #Pacedigitek
Revenue ₹808.17 Cr vs ₹533.45 Cr
(+51.50% YoY┃+45.52% QoQ)
EBITDA ₹158.57 Cr vs ₹94.09 Cr
(+68.54% YoY┃+84.24% QoQ)
EBITDA Margin 19.62% vs 17.64% YoY & 15.50% QoQ
PBT ₹130.34 Cr vs ₹95.59 Cr
(+36.36% YoY┃+59.67% QoQ)
PAT ₹97.28 Cr vs ₹67.86 Cr
(+43.35% YoY┃+55.64% QoQ)
PAT After Minority interest ₹93.89 Cr vs ₹64.08 Cr
(+46.53% YoY┃+53.11% QoQ)
Other Income ₹13.22 Cr vs ₹10.14 Cr YoY & ₹28.34 Cr QoQ

Quality Power Electrical Equipments — Q2FY27
#Q2Results #Q2FY27 #Qpower
✓ Q2 FY27
• Total Revenue ₹294 Cr (+34.1% YoY & +14.5% QoQ)
• Gross Profit ₹134 Cr (+52.6% YoY & +10.7% QoQ)
• Gross Margin 45.6% vs 40.1% YoY & 47.2% QoQ
• EBITDA ₹84 Cr (+70.3% YoY & +29.9% QoQ)
• EBITDA Margin 28.6% vs 22.5% YoY & 25.2% QoQ
• PBT ₹77 Cr (+74.1% YoY & +29.9% QoQ)
• PAT ₹63 Cr (+80.1% YoY & +35.5% QoQ)
• PAT Margin 21.6% vs 16.1% YoY & 18.2% QoQ
✓ H1 FY27
• Revenue ₹550 Cr (+33.2% YoY)
• EBITDA ₹149 Cr (+52.2% YoY)
• EBITDA Margin 27.0% vs 23.7% YoY
• PAT ₹110 Cr (+52.4% YoY)
• PAT Margin 20.0% vs 17.5% YoY
✓ Revenue growth driven by demand across the Group’s high-voltage equipment and power quality portfolios
✓ Winwin Speciality Insulators Acquisition
• Confirmatory due diligence completed with no adverse findings
• Share Purchase Agreement executed on 23 September 2026 for acquisition of up to 100% stake
• Operational progress: type testing completed for porcelain insulators up to 400 kV
• Qualifications and orders secured for 800 kV HVDC, 765 kV and 400 kV applications
✓ Global Coil Factory, Sangli: commenced operations on 20 October 2026, focused on high voltage air core dry type reactors and specialised coil products for HVAC, HVDC, FACTS and renewable energy
✓ PCS facility, Türkiye: commenced operations on 16 October 2026, producing power electronic converters and inverters for utility scale BESS and grid-connected applications, supporting the international BESS order book
✓ Order Book & Forward Pipeline
• Consolidated Order Book ₹2,010 Cr as of Sept 30, 2026
- Endoks ₹800 Cr
- Mehru ₹610 Cr
- Quality Power ₹602 Cr
- Others ₹5 Cr
• Notable wins in HVDC, FACTS and high voltage equipment
• Progress across both line commutated converter and voltage source converter technologies
• New FACTS project and equipment wins across the Americas, Europe, the Middle East and Asia Pacific
• Initial orders for high voltage interconnect equipment serving hyperscale and AI data centre campuses in the United States
• Progress in grid scale battery energy storage opportunities in Europe, supported by customer qualifications and tender conversions
• Developments reflect demand for grid modernisation, renewable integration, transmission capacity and grid stability
✓ Outlook
• Outlook remains encouraging, supported by investments in grid modernisation, high-voltage transmission, renewable integration and energy storage
• Rising electricity demand from data centres, industrial expansion and electrification is creating additional need for reliable grid connectivity and power quality
• Planned transmission network expansion in India and abroad should support demand for high voltage equipment, FACTS and power conversion solutions
• Timely execution and capacity ramp up are key priorities
• Raw material availability and pricing need close attention, particularly electrical grade steel, copper and specialised insulation systems
• New Sangli and Türkiye facilities are expected to strengthen manufacturing capabilities
• Focus on throughput, customer qualifications, supply chain management and quality standards
✓ Management Commentary
• Q2 consolidated revenue ₹285.45 Cr, up 38.7% YoY
• Q2 PAT ₹63.33 Cr, up 80.1% YoY
• Significant international order for FACTS equipment through subsidiary Endoks Enerji in Japan
• Multiple orders for 400 kV instrument transformers through Mehru from Hitachi Energy India
• Orders reflect the technical capabilities of the businesses in serving utilities and leading industry participants across domestic and international markets
• Global Coil Factory, Sangli: designed for high voltage air core dry type reactors and specialised coil products, backed by dedicated high voltage testing and specialised conductor processing capabilities
• PCS facility, Niğde, Türkiye: will make power electronic converters and inverters for utility scale BESS and other grid connected applications
• Both facilities will be progressively scaled up in line with customer requirements and operational plans
• Management expects the business to complement existing capabilities and widen participation in transmission projects (Winwin Speciality Insulators)
• Long term outlook remains encouraging, driven by investments in transmission networks, HVDC interconnections, renewable integration, grid stability and energy storage
• Rising power needs from data centres are creating additional demand for reliable grid infrastructure and specialised power equipment
• Presence across multiple technology segments positions the Group to participate in these opportunities
• Improving manufacturing throughput
• Strengthening supply chains
• Completing customer qualifications
• Progressively ramping up the new facilities
• Continued focus on disciplined execution, timely delivery and operational efficiency


Quality Power Electrical Equipments — Q2FY27 Results 🔔
#Q2Results #Q2FY27 #Qpower
Revenue ₹272.53 Cr vs ₹205.76 Cr
(+32.45% YoY┃+17.13% QoQ)
EBITDA ₹62.96 Cr vs ₹36.23 Cr
(+73.77% YoY┃+53.62% QoQ)
EBITDA Margin 23.10% vs 17.61% YoY & 17.62% QoQ
PBT ₹77.19 Cr vs ₹44.33 Cr
(+74.12% YoY┃+29.91% QoQ)
PAT ₹63.33 Cr vs ₹35.17 Cr
(+80.07% YoY┃+35.53% QoQ)
PAT After Minority interest ₹42.44 Cr vs ₹24.33 Cr
(+74.44% YoY┃+17.51% QoQ)
Other Income ₹21.08 Cr vs ₹13.12 Cr YoY & ₹23.71 Cr QoQ

Mrugesh Trading — Q2FY27 Results 🔔
#Q2Results #Q2FY27 #Murugesh
Total Revenue ₹1.71 Cr
Other Income ₹0.47 Cr
PBT ₹0.14 Cr
PAT ₹0.14 Cr
Market Cap₹ 5,710 Cr🙃

Aurionpro Solutions — Q2FY27 Results 🔔
#Q2Results #Q2FY27 #Aurionpro
Revenue ₹414.98 Cr vs ₹357.67 Cr
(+16.02% YoY┃+15.89% QoQ)
EBITDA ₹71.21 Cr vs ₹71.97 Cr
(-1.05% YoY┃+15.81% QoQ)
EBITDA Margin 17.16% vs 20.12% YoY & 17.17% QoQ
PBT ₹61.16 Cr vs ₹70.39 Cr
(-13.11% YoY┃+16.90% QoQ)
PAT from continuing operations ₹50.20 Cr vs ₹56.66 Cr
(-11.39% YoY┃+11.48% QoQ)
PAT ₹50.20 Cr vs ₹55.85 Cr
(-10.11% YoY┃+11.48% QoQ)
PAT After Minority interest ₹48.97 Cr vs ₹54.35 Cr
(-9.89% YoY┃+6.77% QoQ)
Other Income ₹8.55 Cr vs ₹9.77 Cr YoY & ₹6.68 Cr QoQ

Neogen Chemicals — Q2FY27 Results 🔔
#Q2Results #Q2FY27 #Neogen
Revenue ₹295.96 Cr vs ₹208.66 Cr
(+41.84% YoY┃+18.25% QoQ)
EBITDA ₹45.32 Cr vs ₹29.96 Cr
(+51.27% YoY┃-6.03% QoQ)
EBITDA Margin 15.31% vs 14.36% YoY & 19.27% QoQ
PBT ₹12.72 Cr vs ₹5.15 Cr
(+146.99% YoY┃-45.36% QoQ)
PAT ₹8.23 Cr vs ₹3.37 Cr
(+144.21% YoY┃-51.90% QoQ)
Other Income ₹3.96 Cr vs ₹1.89 Cr YoY & ₹3.86 Cr QoQ

Atlanta Electricals — Q2FY27
#Q2Results #Q2FY27 #Atlanta
✓ Q2 FY27
• Revenue ₹390.1 Cr (+23.1% YoY)
• EBITDA ₹59.6 Cr (+8.8% YoY)
• EBITDA Margin 15.3% (-201 bps YoY)
• PAT ₹32.1 Cr (+28.0% YoY)
• PAT Margin 8.2% (+32 bps YoY)
✓ H1 FY27
• Revenue ₹856.4 Cr (+35.5% YoY)
• EBITDA ₹136.7 Cr (+32.0% YoY)
• EBITDA Margin 16.0% (-42 bps YoY)
• PAT ₹79 Cr (+40.4% YoY)
• PAT Margin 9.2% (+32 bps YoY)
✓ Revenue growth was driven by demand across transmission & distribution, renewable energy and industrial applications
✓ Temporary weather-related disruptions affected order execution
✓ Margin pressure came from elevated commodity prices, particularly on certain firm-price contracts
✓ Temporary production and dispatch disruptions also weighed on profitability
✓ Order Book ₹3,196.97 Cr as of Sept 30, 2026, supported by a healthy enquiry pipeline of ₹19,464 Cr
✓ During Q2 FY27, Secured a ₹193.92 Cr Letter of Intent from APTRANSCO for 12 units of 160 MVA, 220/132 kV Auto Transformers
✓ The order strengthens its position in the high-capacity transformer segment
✓ Capability Expansion
• Manufacturing of the first 315 MVA, 400 kV-class transformer began in October 2026, with short-circuit testing targeted by the end of Q3 FY27
• Dedicated Inverter Duty Transformer facility adds about 5,000 MVA of capacity, targeted for commissioning by Q3 FY27
• Progress continues on the tank and radiator backward integration initiative
✓ Secured its first order from the United States, a milestone in its international strategy
✓ Weather-related disruptions deferred customer deliveries worth approximately ₹180 Cr during Q2 FY27. Around 70% have since been dispatched, with the remaining deliveries expected to be completed in Q3 FY27
✓ Management Commentary
• Q2 revenue from operations up 23.1% YoY to ₹390.1 Cr
• EBITDA up 8.8% to ₹59.6 Cr, PAT up 28.0% to ₹32.1 Cr
• H1 FY27 revenue up 35.5% and PAT up 40.4% YoY, reflecting sustained demand across key end markets
• Elevated commodity prices and unusually heavy rainfall disrupted manufacturing and delayed customer deliveries
• Higher input costs hit margins, particularly on certain firm-price contracts
• Management describes these challenges as largely temporary
• Operations have normalised and dispatches are resuming, so execution momentum is expected to improve in H2 FY27
• Order book of ₹3,196.97 Cr as of September 2026 provides strong revenue visibility
• First order from the United States marks a milestone in the export strategy
• Investments in higher-voltage transformers, including 400 kV and 765 kV products
• Upcoming commissioning of the dedicated Inverter Duty Transformer facility, expected to strengthen competitive positioning and expand the addressable market
• Confident in structural growth across India’s power transmission and distribution sector, backed by renewable energy integration, battery energy storage systems and grid infrastructure


Atlanta Electricals — Q2FY27 Results 🔔
#Q2Results #Q2FY27 #Atlanta
Revenue ₹390.08 Cr vs ₹316.96 Cr
(+23.07% YoY┃-16.35% QoQ)
EBITDA ₹59.60 Cr vs ₹54.81 Cr
(+8.74% YoY┃-22.70% QoQ)
EBITDA Margin 15.28% vs 17.29% YoY & 16.53% QoQ
PBT ₹44.54 Cr vs ₹37.67 Cr
(+18.24% YoY┃-29.95% QoQ)
PAT ₹32.13 Cr vs ₹25.10 Cr
(+28.01% YoY┃-31.40% QoQ)
Other Income ₹3.41 Cr vs ₹1.57 Cr YoY & ₹2.32 Cr QoQ

Corporate Merchant Bankers — Q2FY27 Results 🔔
#Q2Results #Q2FY27 #Corporate
Total Revenue ₹2.28 Cr
PBT -₹2.62 Cr

Unifinz Capital India — Q2FY27 Results 🔔
#Q2Results #Q2FY27 #Unifinz
Total Revenue ₹233.66 Cr vs ₹180.21 Cr
(+29.66% YoY┃+81.03% QoQ)
PBT ₹20.34 Cr vs ₹23.22 Cr
(-12.43% YoY┃-38.41% QoQ)
PAT ₹15.08 Cr vs ₹17.35 Cr
(-13.08% YoY┃-37.28% QoQ)

Sera Investments & Finance India — Q2FY27 Results 🔔
#Q2Results #Q2FY27 #Sera
Revenue ₹40.88 Cr vs ₹2.12 Cr
(+1826.37% YoY┃-30.67% QoQ)
PBT (Excl. Exceptional) ₹36.28 Cr vs ₹1.06 Cr
(+3336.70% YoY┃-37.74% QoQ)
PAT ₹30.03 Cr vs ₹0.91 Cr
(+3205.71% YoY┃-39.63% QoQ)

Studds Accessories — Q2FY27 Results 🔔
#Q2Results #Q2FY27 #Studds
Revenue ₹183.11 Cr vs ₹154.44 Cr
(+18.56% YoY┃+7.92% QoQ)
EBITDA ₹22.78 Cr vs ₹29.85 Cr
(-23.69% YoY┃+16.50% QoQ)
EBITDA Margin 12.44% vs 19.33% YoY & 11.52% QoQ
PBT ₹20.41 Cr vs ₹27.23 Cr
(-25.03% YoY┃+18.70% QoQ)
PAT ₹14.74 Cr vs ₹20.62 Cr
(-28.51% YoY┃+19.88% QoQ)
Other Income ₹3.44 Cr vs ₹2.89 Cr YoY & ₹3.24 Cr QoQ

LG Balakrishnan & Bros — Q2FY27 Results 🔔
#Q2Results #Q2FY27 #LGBala
Revenue ₹948.32 Cr vs ₹787.02 Cr
(+20.49% YoY┃+18.72% QoQ)
EBITDA ₹146.37 Cr vs ₹136.53 Cr
(+7.20% YoY┃+37.99% QoQ)
EBITDA Margin 15.43% vs 17.35% YoY & 13.28% QoQ
PBT (Excl. Exceptional) ₹122.83 Cr vs ₹119.75 Cr
(+2.57% YoY┃+45.54% QoQ)
PAT ₹93.94 Cr vs ₹93.66 Cr
(+0.31% YoY┃+40.19% QoQ)
PAT After Minority interest ₹93.98 Cr vs ₹93.62 Cr
(+0.38% YoY┃+40.24% QoQ)
Other Income ₹16.96 Cr vs ₹14.51 Cr YoY & ₹16.63 Cr QoQ
This Q2 Exceptional Gain of ₹2.49 Cr

Quality Power Electrical Equipments — Q2FY27 Results 🔔
#Q2Results #Q2FY27 #Qpower
Revenue ₹272.53 Cr vs ₹205.76 Cr
(+32.45% YoY┃+17.13% QoQ)
EBITDA ₹62.96 Cr vs ₹36.23 Cr
(+73.77% YoY┃+53.62% QoQ)
EBITDA Margin 23.10% vs 17.61% YoY & 17.62% QoQ
PBT ₹77.19 Cr vs ₹44.33 Cr
(+74.12% YoY┃+29.91% QoQ)
PAT ₹63.33 Cr vs ₹35.17 Cr
(+80.07% YoY┃+35.53% QoQ)
PAT After Minority interest ₹42.44 Cr vs ₹24.33 Cr
(+74.44% YoY┃+17.51% QoQ)
Other Income ₹21.08 Cr vs ₹13.12 Cr YoY & ₹23.71 Cr QoQ
Vishnu Chemicals — Q2FY27 Results 🔔
#Q2Results #Q2FY27 #Vishnu
Revenue ₹429.53 Cr vs ₹401.15 Cr
(+7.07% YoY┃-0.90% QoQ)
EBITDA ₹64.02 Cr vs ₹58.21 Cr
(+10.00% YoY┃-2.21% QoQ)
EBITDA Margin 14.91% vs 14.51% YoY & 15.11% QoQ
PBT ₹48.49 Cr vs ₹45.79 Cr
(+5.91% YoY┃-11.99% QoQ)
PAT ₹35.57 Cr vs ₹32.88 Cr
(+8.16% YoY┃-10.28% QoQ)
Other Income ₹9.57 Cr vs ₹9.37 Cr YoY & ₹12.88 Cr QoQ
