
tracking macro signals & catching falling knives.
Joined May 2025
- Tweets2.6K
- Following888
- Followers7.9K
- Likes18.9K



Pinned Tweet
Like it said macro signals can lead equities by at least 2-3 days or longer.
Before I learned to follow early macro signals it was like flying blind to drops with just retail signals.
Took weeks to understand the metrics but months to learn the art of interpreting them relative to macro, situational, and geopolitical backdrop.


I’m buying into today’s weakness before market close.
Divergence between equities vs macro is an opportunity.
Early macro health signals are diverging from current equity market reaction.
Macro stress metrics are either improving and/or not worsening while the equity market is selling off. Especially versus last week.
Early macro signals usually front run equity market reaction, by a 2-3 days at least.
Hope this helps.
Select metrics vs last week:
- Repo market plumbing system remains clean. Upper and lower bound rates remain within corridor. SOFR, IORB, EFFR, and OBFR and their respective spreads remains healthy.
- SRF usage is essentially unused. Agency $0, Mortgage backed $0, Treasury $1M (vs Dec 2025 of $74B, and 2020 COVID of $84B)
- Move index improved to 76 (from 80)
- Oil improved to $83 (from $93)
- $VIX9D vs $VIX backwardation improved to 1.01 (from 1.20+ inversion highs last week)
- SKEW, Junk bond stress premium, and CCC credit spread did not improve, but also did not worsen.
- $OVX and $VXN did not improve or worsen.
- $DXY and USD broad dollar index did not improve or worsen (Dollar squeeze still in effect for emerging markets)
- Fed bank reserves at $3.06T

thematic rotational tracker showing reallocation across the board out of ai stocks to oversold sectors.
expect continued redistribution across the s&p500.
ai will feel oversold again soon enough but only earnings season will determine if a rebound can hold.
Long end yields starts their reversal downwards here as the market prices for near term rate hikes based on the two years movement after CPI.
2Y continues to lead the 10Y as the yield curve flattens.
Economic calendar for the next two weeks will help decide whether the 2Y @ 4.9% is correct:
- Thu Oct 15, 8:30: Retail sales, PPI, claims. PPI feeds the Oct 29 PCE.
- Fri Oct 16, morning: Fed Chair Warsh. Last Fed voice before blackout. The first read on whether the Fed endorses 100 bps of hikes priced into the front end.
- Sat Oct 17: Blackout begins.
- Wed Oct 21, 1:00: 20Y auction. Long-end supply test with the 30Y at 5.62%.
- Thu Oct 22, 4:30: H.4.1. Bank reserves at $3.03T after the Oct 15 tax and settlement drain.
- Fri Oct 23, 9:45: Flash PMIs.
- Mon Oct 26, 1:00: 2Y auction at 4.9% plus.
- Wed Oct 28, 2:00: FOMC decision. The 3M bill at 4.28% already prices for one hike inside 90 days.
- Thu Oct 29, 8:30: Q3 GDP and September PCE, the morning after.
Important ones: Warsh Friday, FOMC decision, PCE the morning after fomc, and the 20Y auction is the one that can move the 30Y on its own.
It’s getting harder to justify one “credibility hike” for Warsh.
Trump may have to end the Iran war soon.
Immediate of market reaction after Core CPI surprise means continued headwinds for ai infrastructure & momentum stocks across the board:
Although the higher headline cpi was expected due to diesel from Russia/ukraine. Core was a surprise at 0.3% m/m (0.2% expected) which now annualizes to 3.6%, core y/y now rises for a second consecutive month.
Reading whether the 2Y or the 10Y leads the move today will be important:
Within 1 hour after cpi the 2Y up 14 bps, 10Y up 10bps, 30Y up 6bps.
(2Y = market forecast of where the Fed funds rate will be over the next two years...)
2Y at 4.93% against a 3.875% fed funds midpoint = market is betting on more than 100 bps of hikes.
3 month treasury at 4.28% = first of those hikes is expected inside 90 days.
30Y moved the least = long end holders believe more hikes now means less inflation later.
Curve is flattening but could be worse, just be grateful. If the 30Y had led instead of the 2Y it would’ve been gg for the stock market today.
Currently how this report is reaching other macro clusters:
Bond volatility rising (again): MOVE is back above 100.
Dollar strengthening fast: DXY 102.7, broad dollar index 121.6. Higher front end rates pulls capital into USD, as expected.
Crash protection buying: SKEW 155 price of crash protection for the next 30 days is at the highest level on the board. Holders are hedging hard on the 30 day window that contains the Oct 28 FOMC and the Nov 3 election, and a hot CPI aftermath.
Credit spreads still widening: HY 311 bps & CCC 1300 gap widening. The weakest borrowers have been repricing for a higher for longer Fed since September. Today the front end confirmed what the CCC market already assumed.
What is not moving: SOFR sits 1 bp under IORB, bank reserves are back over $3T, the discount window is empty, swap lines are flat. There is no funding stress anywhere. This is a price move, not a plumbing move, and that is what keeps it from being a crisis.
5 of 12 clusters are at warning or worse for me. Nothing on the board resolved this week.
We have retail sales and PPI tomorrow, then Warsh on Friday, the last Fed voice before blackout. We’ll see if he validates the 2Y or if he pushes back…
I have doubts about Warsh’s ability to push back here with core cpi rising again..


The ai sector pullback doesn’t seem to be fully flushed out yet. Still more red to go before a true minicycle reversal. Minicycle reversals last a few weeks to months, use 3/31 and 7/29 as reference point examples.
The macro board has rotated quite a bit and the signals are pivoting & pointing to abnormally heavy tail protection over the next 10-30 days:
Plumbing and liquidity risk from late September has cleared with reserves back above $3.0T, TGA drawn down $68B, net liquidity +$73B, C1 and C9 flat.
What replaced it is a rates repricing with consensus behind it: the 2Y at 4.8% is pricing 92 bps of further hikes against a 3.875% funds midpoint, the 30Y is 5.5%, and bond vol has fallen below CRITICAL for the first time in three weeks because the market has agreed on the direction.
The equity market is not finished pricing it in yet with VIX 15.3, showing front end in deep contango.
But SKEW at 155.1 is CRITICAL, which means tail protection is being bought at the highest level on the board for the window between 10 and 30 days out.
Credit tail keeps widening (CCC 13, two points from crisis) and crypto has flipped to US institutional selling with stablecoin growth negative.

@NavidNamazi said this needed to be a post:
This may be a wild take but it looks like HY spread is the gauge this time for yield reversal, hasnt found a resting zone yet.
With junk stress premium spread stalling at 9 and IG credit spreads slowing down that leaves only ccc credit spread and HY spread still moving in its own.
the only 2 spreads left with velocity left is HY and CCC spread. Once they stabilize i see that as a precursor to long end bonds finding an end to the current directionality, allowing the credit markets to be in a stasis state again.
That is a key early signal for both of our dumb ideas. Nobody likes the chart, nobody likes the macro tape, but it doesn’t take many tailwinds for this reversal to be violent upwards

Picked up more $uwmc from $1.12-1.15 today. All they need is a normal quarter with no hedges to see $2+ again.
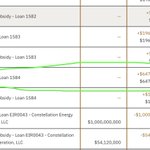
Gambling on $te today with an entry at $3.63 there is a recurring pattern of them only raising convertible debt in small tranches like the $50M from last week. The theory is a DOE loan in the works. The loan entry is an unidentified applicant for $647M approx 75% LTV to G2’s $850m buildout cost. I foundthe loan on the fbb website and verified it, FBB loan number 1584 could be t1 energy’s doe loan. @joemalboeufvt is the first person I saw with diligence on this.
Picked up $nuai as it went down and will keep the lowest cost lots at $5.87 this time. Their letter of credit and 2nd Macquarie tranche should be announced in the next week.
Also picked up more $avav around $139.
Took profits on 30% $cbrs lots from $168 at $181 and holding the rest a little longer.

PCE came in at 3.4% growth vs 3.7% last month. Lower inflation numbers might help the yield. Futures went green immediately and yields went down shortly after report.
We might see green today.
Historically, the best time to enter positions is when velocity deteriorates, which usually occurs right before directionality reverses.
Currently, velocity is still climbing. Since it's currently elevated, we have a good window of opportunity to measure the velocity easier:
C4 (volatility regime) moved first and is now slowing.
C3 (dollar squeeze) is climbing but swap lines remain flat at $70M meaning this is probably a rate driven dollar strength and not a global dollar shortage.
C2 (credit stress) did move last and is now the fastest.
The chain handoff is going downstream (textbook pattern from backtesting), and it means the next place to look is not C4 (volatility regime) anymore. I think the main focus now is on if C2 (credit stress) keeps this pace and specifically if HY (high yield spreads) continues its move towards 3.5
- Velocity is at its fastest point so far for HY (high yield credit spread). In four sessions it made a larger move than it did in the prior two months.
- IG (investment grade spread) is moving too and that is a strong confirmation signal we are currently still in mid adjustment
- IG and HY spreads are widening together right now
- CCC made its move in early September and now the rest of index is currently reacting to find their respective next resting zones.
October 1 it will be important to see if C1 (repo plumbing system) holds because SOFR is already at IORB. If repo plumbing can remain in order (like it is now) as velocity slows down, then we may be able to view that as a reversal point for entries that will be supported by macro tailwinds.

Macro was already overpowering equity before this week, but it just hit another level today. Moved to cash again all recent support levels have been breached across the board.
Can you believe the 10Y was at 3.9% in February and now we’re above 5.2% today?
Iran conflict started end of Feb, what a coincidence.
Oh yeah the 30Y at 5.52% too 🤯
Somebody will eventually want to buy these bonds… right?
Metrics lighting up this morning are largely the same ones from last week:
DXY above 101, dollar is strengthening.
MOVE, VXTLT, and OVX remain at elevated warning levels.


Promising oil data + Trump is making an announcement at 2pm EST on Monday:
October is an important month leading into midterms. Trump wants/needs oil prices to trend downward in October.
I think there will be a solution to oil prices as early as the next 1-2 weeks. Monday does seem premature to expect it though because Xi just flew back to China and back channeling with Iran over the weekend to setup Trump for a Monday announcement would be a bold turnaround time. Unless a lot of it was pre-baked before the visit.
China has much stronger pull & influence with Iran than any other partner country. China is by far their largest oil customer, largest importer, and bilaterally they need to maintain a close/dependent relationship with each other.
We know the current landed cost of Middle Eastern oil to Asia are much higher in cost compared to Europe and other regions. The Eastern and Western superpowers are highly aligned on what needs to happen to oil price for a range of separate reasons, but alignment & urgency is strong here for both sides.
This all stems from the bond market breaking away from monetary systems that interact with it. The monetary plumbing is no longer functioning together with bonds as intended.
We just saw 3 separate monetary policy decisions from US, UK, and Japan on 9/16 through 9/18. The bond market spoke loud and clear: yields shot up.
Japan hiked 2 days after FOMC hiked, but their currency weakened further in the aftermath. Bond markets are experiencing extreme volatility and it’s spilling into Yen currency weakening, the opposite effect versus intended hike goals. Japan will have to sell US bonds and purchase Yen to protect it, then that becomes a frequent and repeating cycle that will continually push our treasury bond yields up since Japan owns more treasury bonds than any other country.
The one way to solve this event-driven problem is: an event-driven solution. The solution probably needs to be backed by both US & China, which I speculate was worked out this week during Xi’s White House visit.
At this point I think even Iran wants the same outcome as US & China too. Most people know Kharg island is too important to Iran, China, and several countries who depend on their exports. However, it is also critical for the Trump administration during October & November midterms to keep it running as well.
It will need to be framed around giving both Iran and US each a way to claim political victories and I think China is the key to that backdoor access to end the conflict.
Promising oil data is also starting to emerge on Hormuz & Middle East. Landed costs are still high but improving. Crude prices will go down first, but diesel prices may not immediately follow and could linger for longer at elevated levels.
Alexander’s data shows oil exports back 94%, it seems surprisingly high but even other sources show >70% volume recovery versus pre-war level. With 1-2 more EIA reports we should have much better clarity.

Macro update:
A lot of signals moved the last 24 hours.
- 10Y yield continues its streak of higher lows for the 4th consecutive day. Now 5.18%.
- 30Y same as the 10Y in consecutive higher lows. Now 4.474%.
- crude oil has held steady in a band between $90-96. Now $92.
- USD/JPY fell slightly to 157 range. Which is good the more it falls for treasury bond yields and the yen carry traders.
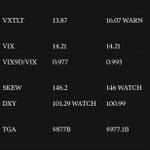
A lot of signals that are precursors to the VIX have fired off. Why VIX has not followed yet is because the equity desks have not been forced to sell, yet…
- MOVE index went from warning to critical. Now 104.6 (yesterday 95.5) on a high velocity move. This is a measurement of 2Y, 5Y, 10Y, 30Y bonds.
- VXTLT popped off and went from normal straight to WARNING (skipped WATCH signal). Now 16.07 (yesterday 13.8) This only measures the treasury volatility of long end only bonds (20Y, 30Y).
- SKEW still at 146 in my WATCH zone. It measures how much more expensive OTM S&P puts are than calls.
- VIX is the price of ATM insurance
- SKEW is the price of catastrophe insurance relative to it
- DXY dropped slightly from yesterday’s highs. Now 100.9

