

Just Gold - Just Charts - Just For Investors. Visit our website to access the Gold Market Chartbook.
Joined January 2025
- Tweets1.1K
- Following885
- Followers3.7K
- Likes2.5K

Pinned Tweet
Find out what's really going on in Precious Metals with the latest monthly pack: gold.topdowncharts.com/p/gol…

Gold Market Chartbook - March 2026
Find out what's really going on with precious metals...
Download the latest pack: gold.topdowncharts.com/p/gol…

Gold Market Chartbook retweeted

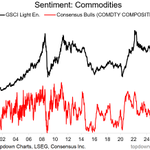
Crude Oil Sentiment: bulls hovering just above 50% --a lot of people don't believe the oil spike is going to last...

Gold Market Chartbook retweeted
Tech Capex Crowd-out
Tech and tech related capex has ballooned to now half of all corporate capex among S&P500 companies. 👀

Gold Market Chartbook retweeted

The last ChartStorm of @Callum_Thomas is a master class about #Commodities.
Just open to see what great period is expected for all investors here. 👇
open.substack.com/pub/charts…


Gold Market Chartbook retweeted

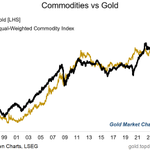
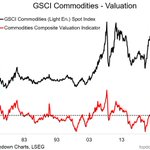
This may be one of the most important charts in the world right now.
Many investors try to disconnect gold from the broader commodity complex.
In reality, the opposite is often true.
Gold frequently leads moves across other resource markets.
I’m constantly thinking about what the next mover in the commodity space might be, especially as we’re seeing such a sharp advance in metals.
👇👇👇
tavicosta.substack.com/p/the…
H/t to @topdowncharts for the great chart.


Chart from our recent Deep Dive on the Outlook for commodities: chartstorm.info/p/off-topic-…

Commodities
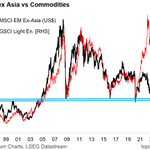
Cross-Confirmation
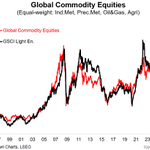
The more commodity-sensitive Emerging Markets ex-Asia + Commodity price index both breaking out = believe it...

Read more on the outlook for commodities + EM here: chartstorm.info/p/off-topic-…

Gold Market Chartbook retweeted

Chart of the Week - Defensives
With tech in trouble (+a number of macro risks lurking on the horizon), defensives are starting to look interesting…
Defensives (i.e. an equal-weighted basket of: Utilities, Healthcare, Consumer Staples) are turning up vs the S&P500 —after going through what has been a major relative bear market.
But in particular, the following conditions make for a contrarian bullish (relative) setup for Defensives:
Defensives’ relative value indicator reached similar levels to that seen at the peak of the dot com bubble (Defensives are extreme cheap vs the index).
Investor allocations to defensives are ticking up from record lows.
The market cap weight of defensives reached an all-time low late last year.
The relative price (black line in the chart below) has seen an extended and extreme period of underperformance.
And on the flipside, US (tech) stocks have likewise seen a number of extreme readings on sentiment, valuations, and allocations in the opposite direction (i.e. overall stock market downside risk is higher than we’ve seen since 2000 due to the key growth engine of tech stocks being overheated and looking somewhat burnt out lately).
Interestingly, this bullish outlook for defensive stocks is actually bearish for the stockmarket as a whole…
To be clear, when I say bullish outlook for defensives, I mean in relative terms — i.e. you expect defensive stocks to fall less or at best hold ground while the rest of the market falls more.
In this sense, defensives are interesting to keep tabs on both as a source of information on the market cycle (they fare relatively well in a downturn and lag behind in an upturn), but also as a sort of alternative hedge or portfolio risk dampener.
So seeing the defensives’ relative performance line ticking up from extreme lows (and the contrarian bullish setup for defensives I just outlined) tells us we need to pay closer attention to risk management and smart diversification right now.
Key point: Defensives are looking good (that’s bad).

First highlighted this chart back in late-2024, interesting to see it finally on the move and resolving that massive triangle pattern...
Note from back then: chartstorm.info/p/weekly-s-a…

Gold Market Chartbook retweeted
The typical ETF investor has about half their portfolio in Tech Stocks (!)
😳


Gold Market Chartbook retweeted
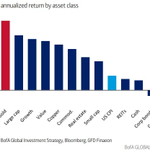
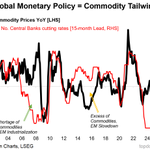
Commodities are following the monetary script...
2026 is the year of global growth reacceleration (and inflation resurgence).
Watch this space! 👀

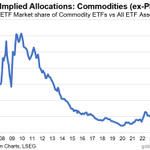
Outside of Precious Metals, investors have hardly any exposure to Commodities.
(this leaves them vulnerable to inflation flare-ups e.g. if global growth reaccelerates and commodity prices surge)
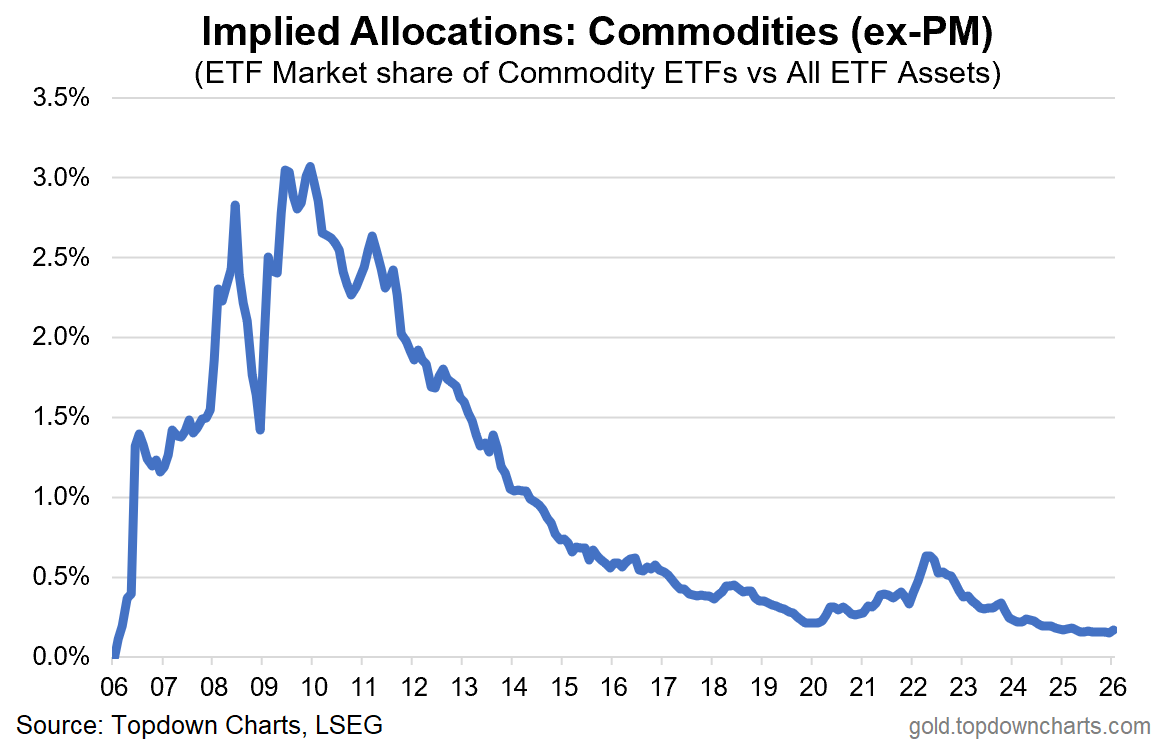
More on the outlook for Commodities (at the asset-class level): chartstorm.info/p/off-topic-…