Analysis - Assessment - Investment - Construction HCCVenture Quantitative Data JointStock Company (HCCVENTURE QUANT JSCO) --Notification : https://nitter.gq/t.co/n9uekkZNUx
Vietnam
Joined June 2024
- Tweets1.7K
- Following101
- Followers1.9K
- Likes2.2K







Pinned Tweet
Crypto Report 2025 compiled by #HCCVenture
2025 marks a major step forward for the global cryptocurrency market. While 2021 was a testing and foundational phase, 2025 is the year the cryptocurrency market enters its most mature stage, transforming from a virtual asset into a financial and technological infrastructure, reshaping the global financial and economic structure.
Cryptocurrencies are no longer considered merely virtual currencies or virtual assets; most countries are now gradually integrating them into their national economies. Cryptocurrency assets are measured by network throughput, payment value, and the degree of integration with mainstream communication systems and financial business systems.
This report was compiled by a team of cryptocurrency market research and analysis experts, on-chain blockchain evaluators, and unit auditors from #HCCVenture.
This report outlines a comprehensive picture of the overall development of the cryptocurrency market in 2025, and the insights gathered will form the basis for future market trends in 2026.
We thank our partners and collaborators who co-reviewed the report with HCCVenture, including: @HoldstationW, @whatexchange , @Followinvietnam , @LBank_Exchange , @Gate , @KuCoinInst , and @defiapp .
This report, compiled and published by #HCCVenture, aims to provide information, analysis, and research perspectives related to the digital asset market, blockchain technology, and related digital economic sectors. The entire content of this report reflects the professional opinion of the #HCCVenture Research & Advisory Board at the time of publication, based on publicly available data, information, and analytical models that they deem reliable. This report is for informational and research purposes only and does not constitute a proposal, recommendation, or investment advice of any kind. #HCCVenture assumes no responsibility for any investment decisions, transactions, or actions taken based on the content of this report. Readers should assess the appropriateness and tolerability of the risk and consult with professional advisors before making any financial decisions.


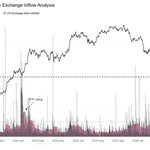
The key point to watch is not just the amount of bitcoin:native being listed on exchanges, but whether spot demand is strong enough to absorb the supply from investors who have held #Bitcoin for a long time.
The flow of bitcoin:native from Long-Term Holders (LTH) to exchanges has decreased significantly compared to the peak period of May–July 2026. The 30-day moving average is currently narrowing to around 3.2%, noticeably lower than previous surges.
- Distribution pressure from long-term holders is gradually easing.
However, the current level is still higher than the 1-2% support zone typically seen during periods when LTHs are listing less supply. Therefore, it is premature to conclude that long-term holders have fully returned to an accumulation phase.
If LTH Exchange Inflow continues to fall to the 1-2% range while bitcoin:native holds its key support levels, the market will have further grounds to confirm that selling pressure from long-term holders is being absorbed.


Capitulation pressure has eased, but profit-taking supply remains.
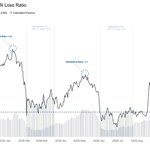
#Bitcoin experienced two significant periods of selling pressure in 2026. In early January, the Realized P/L Ratio was recorded around 1.0, reflecting a relatively balanced realized profit and loss.
Notably, after the second downturn, Bitcoin gradually stabilized around the $60,000-$65,000 range before a strong recovery from August.
By October 17th, the Realized P/L Ratio had risen to approximately 2.8, while bitcoin:native approached $85,000-$86,000, indicating a significant increase in profit-taking activity as the price recovered.
However, by the end of October, there were signs that profit-taking momentum was easing, but it was not yet sufficient to conclude that selling pressure had completely disappeared.

Capitulation pressure has eased, but profit-taking supply remains.
#Bitcoin experienced two significant periods of selling pressure in 2026. In early January, the Realized P/L Ratio was recorded around 1.0, reflecting a relatively balanced realized profit and loss.
Notably, after the second downturn, Bitcoin gradually stabilized around the $60,000-$65,000 range before a strong recovery from August.
By October 17th, the Realized P/L Ratio had risen to approximately 2.8, while bitcoin:native approached $85,000-$86,000, indicating a significant increase in profit-taking activity as the price recovered.
However, by the end of October, there were signs that profit-taking momentum was easing, but it was not yet sufficient to conclude that selling pressure had completely disappeared.

READ IT.

Another attack on a CEX exchange (Binance suffered the heaviest losses this time, up to $5 billion...).
As I've shared research on security and supply chain management of cash flow on CEX exchanges,
I believe that over 90% of the time, hackers target vulnerabilities in the withdrawal transaction control systems of CEX exchanges.
The entire research below was conducted by me and my team over four days following the Bitget attack.
I truly believe we should stop innovating with new features and trading contracts and focus on "security research."
That's a prerequisite for this market's survival. "Cryptographic" is the pioneering term for this type of asset, and it must revolve around security and safety.
My document may be helpful for CEX exchanges to expand their research in one way or another.
Could you please take a moment to review it?
cc to @cz_binance , @GracyBitget, @star_okx, @vladtenev , @usithetalk , @benbybit , @Han_Gate, @kris , @justinsuntron , @Vivien_BingX


HCCVenture retweeted

The amount a protocol earns is less important than the actual value it delivers to holders.
The crypto market is gradually adopting a valuation approach based on earnings and cash flow, rather than solely on narrative.
The HCCVenture chart compares the adjusted earnings yield of a protocol with the tokenholder yield, revealing a significant gap between the economic value a protocol creates and the value delivered to token holders.
- $CAKE is the clearest example: earnings yield reached 14.4%, but tokenholder yield was only around 2.6%.
- $LIT also shows a large difference, with 14.1% compared to 7.9%.
- $HYPE converts approximately 8.0% of its 9.8% earnings yield into holder returns, indicating a higher level of value transmission.
- $RAY, $AAVE, and $JUP have positive earnings yields but negative tokenholder yields.
This reflects how token issuance and incentive mechanisms can diminish the net benefit for holders.
This confirms that protocol revenue does not equate to the accumulated value of the token.
Conversely, transaction fees and lending are only the starting point; buybacks, burns, profit distribution, staking rewards, token unlocks, and supply inflation determine which value actually reaches the holder.
A protocol with strong economic activity can still have poor tokenomics if its benefits are absorbed by token issuance and incentives.
In our assessment, the accumulation of net value per token is central to the current #DeFi market. In the long term, assets with sustainable business models, measurable earnings, and transparent value distribution mechanisms will have a more solid valuation foundation than tokens that rely primarily on growth expectations.

HCCVenture retweeted
Private Equity Valuation Market Grows 11-Fold in 10 Weeks
The perpetual contract market for unlisted companies is rapidly expanding, opening up a new mechanism for investors to access valuation fluctuations of private companies before IPOs.
According to data from HCCVenture, total open interest increased from $10.8 million on August 1st to $124.1 million on October 11th, 2026, an increase of approximately 11.5 times. This indicates a significant increase in demand for trading and speculating on private equity valuations.
Notably, the market is expanding from Binance to Hyperliquid and Bybit, but liquidity remains highly concentrated. Anthropic accounts for 71% of the open interest tracked, while Anthropic and OpenAI combined account for approximately 97%.
Essentially, perpetual markets create a continuous price discovery mechanism before a company goes public, allowing participants to express their valuation expectations without directly owning shares. However, open interest reflects the size of open contract positions, not the amount of direct investment in the company.
The contract price can also deviate significantly from the valuation of the funding round or the future IPO price due to leverage, liquidity, and the operating mechanisms of each platform.


The cost of capital is becoming a key variable between #Bitcoin and #USbond yields.
The chart shows that the yield on 10-year US Treasury bonds has risen from a low of under 1% in 2020 to around 4-5% recently, while #Bitcoin has maintained a long-term uptrend but has experienced several periods of significant volatility.
-> bitcoin:native doesn't move entirely in line with bond yields, although the two are related through financial conditions and risk appetite.
When yields rise due to higher real interest rates and tighter monetary policy, the opportunity cost of holding Bitcoin increases, while capital flows may favor income-generating assets. Conversely, if yields fall along with improved liquidity and expectations of policy easing, the valuation environment may be more favorable for bitcoin:native.
However, falling yields due to recession fears or increased safe-haven demand do not necessarily have a positive effect on risky assets.
It's clear that what matters isn't just whether 10-year yields rise or fall, but the underlying causes of that movement. A rise in yields due to robust economic growth may have a different meaning than a rise due to inflationary pressures or an increased term premium. Similarly, a fall in yields due to cooling inflation differs from a sharp decline due to recession risks.

Bitcoin remains in a correction phase as short-term liquidity weakens and macroeconomic pressures outweigh spot demand. The recovery is not strong enough to sustain the upward momentum.
HCCVenture retweeted
A shallower bear market than previous cycles
The major difference in the current cycle is that Bitcoin has undergone a deep correction but has not closed below the Realized Price, the average cost basis of all circulating bitcoin:native supply.
According to the chart, even at the lowest closing price on June 30th, bitcoin:native was still about 10% above the Realized Price and continued to remain above the Long-Term Holder Cost Basis.
In the bear markets of 2018 and 2022, bitcoin:native remained below the Realized Price for many months, reflecting widespread losses and stronger selling pressure. Conversely, the current cycle shows that the price decline has not yet translated into deep damage across the entire market's cost basis.
Notably, bitcoin:native has now recovered above the True Market Mean and Short-Term Holder Cost Basis. This signals that the group of investors who recently bought are gradually regaining profitable positions, and the price structure is improving after the correction phase.

Speculative leverage is heating up for individual tokens, but hasn't spread across the entire market.
The Altcoin Froth Indicator is sending a noteworthy signal.
Coin Froth has been in the top 20% of its all-time highs since September 28th, while Global Froth remains in the lows and hasn't returned to the extremes since the October 2025 crash.
This divergence suggests that speculative risk is concentrated in individual altcoins, rather than spreading across the entire market. Some tokens may have accumulated significant leverage and trading positions, but that doesn't necessarily mean the entire altcoin market is entering an overly euphoric phase.
The key point is that the risk is currently localized, but it could be amplified as market conditions worsen. If Bitcoin weakens and retests the support zone around $80,000, highly leveraged altcoins and those with concentrated speculative positions could face greater liquidation pressure, leading to increased price volatility even before the Global Froth peaks.
In my view, the altcoin market currently does not show signs of broad-based speculative euphoria.

HCCVenture retweeted
US stock valuations are facing a notable divergence, with September 2026 data showing the S&P 500 trading at a 5-year CAPE of approximately 28.3x, while 10-year real yields are about 62 basis points higher than potential real GDP growth.
-> Real interest rates are putting pressure on valuation ratios, but the stock market is maintaining high P/E ratios, near the levels seen during the peak valuation periods of 2000 and 2021.
Historically, valuation ratios are often high when real yields are slightly lower than potential real growth.
When real yields fall too far below growth, inflation can erode valuation ratios; conversely, when real yields significantly exceed growth, high capital costs often put pressure on P/E ratios to narrow.
The current position is on the side of higher real yields over growth, but CAPE remains near 30x – a mismatch between discounted conditions and market valuations.
Corporate earnings, growth expectations, and the concentration of high-quality businesses could sustain high valuations for longer than anticipated. However, with high CAPE, the market will be more sensitive to changes in real yields and earnings prospects.

HCCVenture retweeted
Non-USD Stablecoins See Five-Fold Supply Increase, Opening Up a New Liquidity Structure Beyond the USD
The supply of stablecoins pegged to currencies other than the USD has increased from approximately $205 million to $1 billion in two years, reflecting the expansion of the local currency-denominated stablecoin market.
This momentum stems not only from the demand for crypto transactions, but also from a clearer regulatory framework in Europe, particularly MiCA, which provides regulated institutions and issuers with a stronger foundation for product development.
Circle's EURC stands out in on-chain trading, FX, and DeFi due to its liquidity and integration with protocols like Uniswap, Aave, and Morpho. Meanwhile, stablecoins other than EURC tend to serve more practical needs such as domestic payments, payroll, and settlements.
According to the data provided, EURC accounts for 45.7% of the tracked supply but 90.1% of the reported trading volume in the 30 days ending September 15, 2026. This disparity suggests that liquidity and market usage are currently significantly concentrated in EURC, while other stablecoins may be developing in the direction of payments and remittances.
EURC is building its position in the on-chain financial infrastructure, while local currency stablecoins have the opportunity to expand through actual payments and settlements.
If this trend continues, stablecoins could evolve from crypto trading tools into a multi-currency payment infrastructure layer, although their current scale remains small compared to the USD-pegged stablecoin market.

A shallower bear market than previous cycles
The major difference in the current cycle is that Bitcoin has undergone a deep correction but has not closed below the Realized Price.
According to the chart, even at the lowest closing price on June 30th, BTC was still about 10% above the Realized Price and continued to remain above the Long-Term Holder Cost Basis.
In the bear markets of 2018 and 2022, BTC remained below the Realized Price for many months, reflecting widespread losses and stronger selling pressure. Conversely, the current cycle shows that the price decline has not yet escalated into deep damage across the entire market's cost basis.
Notably, BTC has now recovered above the True Market Mean and Short-Term Holder Cost Basis. This signals that the group of investors who recently bought are gradually regaining profitable positions, and the price structure is improving after the correction phase.

#Bitcoin is forming a base with an improved on-chain structure, as selling pressure eases and the price holds key support levels. However, supply from investors who bought at higher prices remains a barrier, meaning the uptrend needs new capital inflows.

#Bitcoin is forming a base with an improved on-chain structure, as selling pressure eases and the price holds key support levels. However, supply from investors who bought at higher prices remains a barrier, meaning the uptrend needs new capital inflows.
On-chain Status: From Stablecoins to the Entire DEFI and RWA Ecosystem
On-chain yield is not a new source of profit separate from the traditional financial system; it is the process of tokenizing, programming, and restructuring existing economic income sources on the blockchain.
On-chain yield is shifting toward sustainable cash flows, driven by lending interest, protocol fees, staking, tokenized Treasuries, and real-world financial activity rather than token incentives alone.
-----------------------
DeFi TVL has recovered to approximately $96.7B, up around 156% from the September 2023 bottom, while stablecoin market capitalization has reached approximately $307B, reflecting a substantial expansion in on-chain liquidity.
Stablecoins are becoming the foundation of on-chain yield systems, but total supply does not equal productive capital; the proportion deployed into yield-generating protocols is a more meaningful indicator of ecosystem growth.
Lending yields are determined by borrowing demand and capital utilization, meaning APY fluctuates with liquidity conditions and should not be interpreted as a guaranteed long-term return.
Liquid staking and restaking improve capital efficiency but introduce layered risks, as additional yields compensate investors for greater smart-contract, liquidity, leverage, and protocol dependency risks.
Yield tokenization is transforming DeFi into a more sophisticated financial market, allowing users to separate principal from yield, lock in returns, and trade yield expectations over specific periods.
Real-yield strategies are gaining importance over incentive-driven farming, as investors increasingly prioritize transparent revenue sources, sustainable returns, and risk-adjusted yield.
The key metric is no longer APY alone, but yield quality-including the underlying cash-flow source, sustainability, capital utilization, liquidity, and risk required to generate returns.


Read more : hccventure.com/en/on-chain-s…

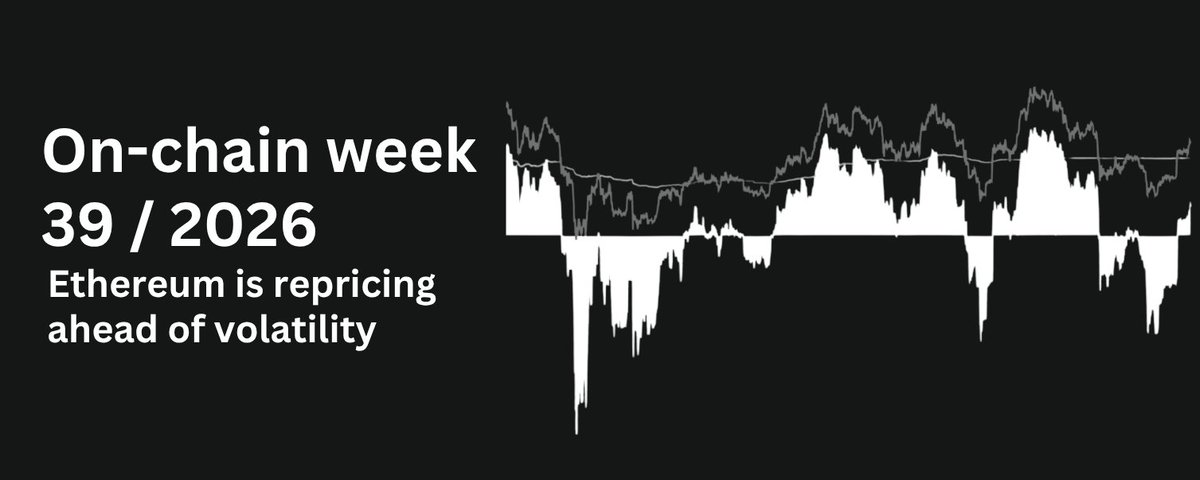
#Ethereum is recovering but hasn't yet entered the high-risk growth zone?
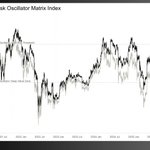
Data from the AVIV Risk Oscillator shows Ethereum currently fluctuating around 1.0-1.1, above the Deep Value Zone but not yet reaching the high-risk zone.
This indicates that ethereum:native has emerged from a deep discount period since the beginning of 2026, but significant profits haven't been realized yet, and distribution risk is beginning to increase.
Currently, 1.0 is acting as a crucial equilibrium zone. ethereum:native has reclaimed this zone but hasn't created a large enough gap to confirm a new price expansion phase.
Therefore, the next important signal isn't just a price increase, but for AVIV to remain above 1 and continuously form higher peaks.
If AVIV continues to expand while ethereum:native maintains its upward trend, the market will have more room for a price reassessment. Conversely, another drop below 1 would indicate that the valuation recovery process is not yet complete.

HCCVenture retweeted
When a large-scale asset breach occurs, will the custody facilities storing user assets remain secure enough ? What continuous changes are needed for a new CEX future ?