

Iowa WQIS integrates data gathered by IIHR—Hydroscience & Engineering and the United States Geological Survey and offers access to real time nutrient data.
Iowa City, IA
Joined January 2016
- Tweets305
- Following0
- Followers216
- Likes9
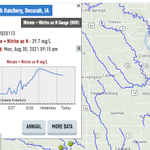


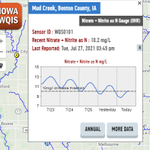


Props to @iowadnr fish hatchery staff at the Chuck Gipp fish hatchery for hosting a water quality sensor.
We have learned A TON about the contaminant hydrology in the Upper Iowa River Watershed just over the past 48 hours with their help.
iwqis.iowawis.org/app/

Incoming nitrate tile water to a saturated buffer in Adair County >40 mg/L (N) during a drought! iwqis.iowawis.org/app/

It's a new era for water monitoring in Iowa's Paleozoic Plateau (Driftless Region) where Iowa's best streams our threatened. iwqis.iowawis.org/app/

Last week our team installed a nitrate sensor in the spring supplying water to the Iowa DNR Decorah fish hatchery. Very high nitrate in that water--22 mg/L as N. Karst aquifers in NE Iowa are highly contaminated with nitrate. iwqis.iowawis.org/app/


New sensor deployment in the network at Bloody Run Creek in Clayton County, in collaboration with @UICHEEC.
iwqis.iowawis.org/app/

When the P Index matters.
nitter.gq/AurelGrains/status/117…

Which Iowa HUC8 Watershed do you think had the highest average corn yield (bushels per acre) from 1999-2018? Soybeans?

Three sensors now track nitrate in the main Cedar River Branches: Shell Rock River, West Fork of the Cedar River, and Cedar River at Janesville. Cedar River watershed has 11 nitrate sensors in total, most of any basin.

How do we live with the new reality of flooding in Iowa? desmoinesregister.com/story/… via @DMRegister

Iowa WQIS retweeted

Iowa has about 3 million people. The state's livestock far outnumber us. They produce as much manure as "134 million people, which would place Iowa as the 10th most populous country in the world"
A staggering analysis by @IIHRUIowa's Chris Jones.
iihr.uiowa.edu/cjones/iowas-…
#ia

Iowa WQIS retweeted
Powerful words by Chris Jones of @IIHRUIowa:
"[W]e knew our water was degraded, we knew what caused the degradation, we had ideas on how to fix it, but we didn’t fix it."
"And the reason we didn’t fix it is because we lacked the courage..."
iihr.uiowa.edu/cjones/ransom…
#IApolitics

Iowa has about 3 million people. The state's livestock far outnumber us. They produce as much manure as "134 million people, which would place Iowa as the 10th most populous country in the world"
A staggering analysis by @IIHRUIowa's Chris Jones.
iihr.uiowa.edu/cjones/iowas-…
#ia
Sensors are going in: iwqis.iowawis.org/app/
This week's planned deployment:
58 Willow Cr, Kellogg
59 Perry Pond, Kellogg
63 Yellow R, Ion
64 Upper Iowa R, Dorchester
8 CREP Wetland, Orchard
12 Slough Cr, Orchard
13 Beaver Cr, Bassett
14 Beaver Cr, Colwell
38 Squaw Cr, Ames
Iowa WQIS retweeted

A well water study known as SWRL2 (a follow-up to a study in the late 80's) sampled hundreds of wells across the state. How many of the wells had bacteria? Nitrate? Arsenic? Read about the CHEEC supported study here: cheec.uiowa.edu/research/iow…


Iowa WQIS retweeted
Domestic animals in Iowa create as much waste as how many people???
@IIHRUIowa's Chris Jones explores Iowa's water quality challenges from unique angles on his blog. Read more here, then check it out for yourself. @RiverRaccoon
iowaenvironmentalfocus.org/2…
Iowa WQIS retweeted

Good discussion and analysis on the cost vs benefit of using cover crops to reduce N losses from corn and soybean fields. Spoiler: cost >> benefit (other cc benefits not included)
h/t @RiverRaccoon
iihr.uiowa.edu/cjones/econom…
