

Markets. Risk. Humanity. History. ex-SDE/SDM turned trader. An aspiring flaneur looking for optionality. "Freedom is not free".
Canada, Lebanon
Joined November 2010
- Tweets3.2K
- Following328
- Followers863
- Likes3.1K




Seeing the breakeven chart surface again. If you are curious about the breakeven math:
It takes a return of r / (1 - r) to recover from a loss of r. e.g. it takes a return of 0.3/0.7 = 42.86% to get back to breakeven after a 30% loss.


Live to fight another day!
Today's price action was confusing, perhaps by design. After yesterday's brutal selloff, shorts still have reason to feel hopeful. Which is exactly why I suspect many will get stopped out next week. Just a hunch, nothing more.
That said, I'd welcome another -6% day in the #NDX. I do own $SPY and $QQQ puts!

Interesting to see some beaten down growth (e.g. $NET) and hyper growth / speculative names (e.g. $RIOT, $QBTS) showing relative strength after yesterday's brutal and broad selloff. These stocks have taken a beating over the past month, yet already filled yesterday's gaps and some are now green on the week!
I don't know if this is a tell, but I'll be watching and might trade some next week. $RIOT looks quite interesting as a trade!


Yesterday, the $VIX plunged 20%. Today? It surged as much as 65% intraday! A single-day VIX gain of 50%+ is exceptionally rare. Since 1990, it has happened only 10 times: 8 times in the past 20 years and twice in the early 1990s.
Historically, betting on a VIX decline after such extreme spikes has worked well. But with such a tiny sample size, take those historical odds with a grain of salt!


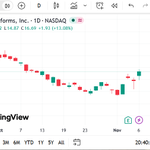
At 16.67, the $VIX is down 20% in a single day - a significant move that has occurred only a handful of times over the past decade.
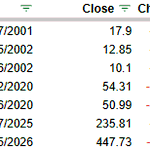
I hardly ever base any of my investment or trading decisions on the $VIX (except shorting the VIX after huge spikes), but I thought it would be interesting to see where it stood 5, 10, and 21 trading days after those rare occurrences:

Betting on a few more strong days for $QQQ. Got a decent fill on the Nov 13 $710 calls at $2.87.


At 16.67, the $VIX is down 20% in a single day - a significant move that has occurred only a handful of times over the past decade.
I hardly ever base any of my investment or trading decisions on the $VIX (except shorting the VIX after huge spikes), but I thought it would be interesting to see where it stood 5, 10, and 21 trading days after those rare occurrences:
Same analysis, but this time using a -15% (or worse) single day drop in the $VIX.
P.S. It is actually interesting 2022 and 2023 didn't have such VIX-crash days, even though 2022 was a bear market 🤔

Time for $CAT again? I usually buy $CAT after 3 consecutive oversold days. This time, I held off because of earnings, which came out yesterday and clearly didn't impress the market.
Today marks the 5th consecutive oversold day. That's a rare occurrence over the past 10 years, and I like the odds of a bounce here.
Bought a half position at $589.67.


Consider the COVID crash, when SPY fell roughly 34%. SPXL dropped about 77% rather than the 100% that a simple 3x calculation would suggest.
Of course, this is an extreme example of a relatively sustained decline. In reality, markets often experience more sideways chop and sharp reversals, where daily compounding can work against leveraged ETFs and erode returns over time.

