

Kaizen (Japanese: 改善, 'improvement') We follow the market, no one can predict it. - Crypto trader. https://xitter.cf/t.co/IOai3LIL4M
Markets
Joined April 2022
- Tweets9.2K
- Following585
- Followers528
- Likes9.9K





Pinned Tweet
buymeacoffee.com/kaizenchart…
It's here. And it's free (for now).
14 pages of content on Elliot Wave Theory.
This will help you understand the:
-Rules.
-Patterns.
-Fibonacci levels.
-And more...
EW Theory can help predict price movements and current structure.
Identify corrective waves patterns which can allow you to anticipate price action.
I made this to improve my skills and edge. I believe having more knowledge can lead to more potential profits.
Enjoy the read. Likes and reposts much appreciated fam.


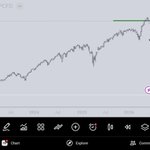
$spx had a weekly engulfing and dipped below the level I discussed a while ago.
We could be seeing a retrace on a multi week downtrend.
#trading


Taking pretty much the full move from the previous re-test of support last Wednesday with the last two trades.
Catched the impulse last week and already closed a short with the pull-back.
Expecting lower.
The key level to watch imo: previous week's opening.
If we lose it, a test of the swing lows is high probability, even taking the previous week's low (high was taken though).
#btc #trading


buymeacoffee.com/kaizenchart…
Here is a link to one of the two free custom indicators on my chart.
Find the other one on the page too with other free guides and resources.
Follow for more updates.


#btc is opening the week above the previous weekly opening (pic 1)
But the quarterly opening is very close and this is likely a level which will act as resistance (pic 2).
Don't be deceived by this bullish sign as this was to be expected after the impulsive move down the week before last.
The higher probability scenario right now is $btc hitting resistance and testing another support level lower from the 2024 range.
Both of my indicators on the chart are free. Check them out via link in profile.
#crypto


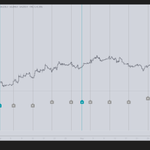
Sharing a new indicator which I find useful.
Allows to identify trend progression by splitting the chart on given time spans with customisable vertical lines.
I find it useul too for backtesting since you can clearly identify a given time period and compare price action and patterns.
Following timeframes available:
-H4.
-Days.
-Weeks.
-Months.
-Quarters.
-Semesters.
-Years.
Free link in bio...other resources available.
#crypto #trading

buymeacoffee.com/kaizenchart…
Here is the direct link to the item on the page.
Others available to check.
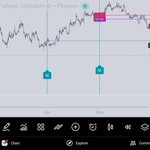
#btc trading below the quarterly open.
Price has only managed to sweep the previous quarter low and is now above it.
The key will be at the close Vs the level on pic 2 - 62.7k
Close above and the next quarter has high probabilities of being bullish.
Close below it and the next quarter has high probabilities of being bearish.
#crypto


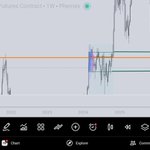
#btc found support at the VAL of the previous multi month range mentioned in the post below.
It's likely we see a test of the POC first.
#crypto


Was last week's PA the confirmation of support and price has accepted above the S-R level?
We could be testing higher.
$autonomi #altcoins


About the low being in or not...
I posted this observation about the existing structure not resembling a swing low. It seems it had a point.
Here is what I was expecting to see for a low. Not saying it's in but the PA structure forming looks more like a possible swing low.
#crypto #btc


The chart which often serves as one of the best confluence for #btc price:
$usdt.d
Has reversed the downtrend and made a quick move up being now at key resistance.
What could this mean for BTC...
It has found support.
Usdt.d dominance is likely to reject resistance and continue lower to the support level mentioned (green box below).
This would mean BTC would move higher from here.
#crypto


$btc dominance at support level⚠️
As explained in the post below, this has been a multi month support level.
Is this level where #btc price can find support too and move higher...
#crypto

$btc dominance rejected the mayor level which has marked several cycle tops when reached.
But the rejection has held support since August 2025.
Holding support during a monthly uptrend like that one can only signal strength.
This means to me there are still probabilities of uptrend continuation to test the box territory again.
#crypto #trading

As posted below, after breaking the first level $btc was going to test the level below.
These are levels fairly strong and how price resolves them is key for the next move.
This time #btc has swept it already and is trading above it.
Price is very likely to test higher now and this could even be the low of the month.
#crypto


$btc dominance rejected the mayor level which has marked several cycle tops when reached.
But the rejection has held support since August 2025.
Holding support during a monthly uptrend like that one can only signal strength.
This means to me there are still probabilities of uptrend continuation to test the box territory again.
#crypto #trading
#BTC dominance broke inside the rectangle area.
Can this be decisive to the cycle HTF trend like it has been in the past?
Or do we need to test the top of the rectangle?
For now, let's see how price reacts to the previous quarterly POC (earlier post).
