

Pizzeria Owner/Landlord/Breast Cancer Warrior/Chartist & Trader of Stock Market/Post $NASDAQ Chart Daily/WON'T DM YOU
Show Me State, USA
Joined July 2017
- Tweets26.6K
- Following767
- Followers7.5K
- Likes97.9K




Pinned Tweet
How to read my charts:
BB=Bollinger Band
upper & lower BB=solid yellow
mid BB=dashed yellow
EMA=Exponential Moving Average
13EMA=blue, 50EMA=purple, 200EMA=green
TL=Trendline
MOMO=Momentum
MACD=MOMO indicator
STOCH=Stochastic MOMO indicator

$NASDAQ DAILY chart for Wednesday
A little sideways action today
Eventually price will back test 13EMA blue. Bulls want price 2 move up towards 13EMA blue while Bears want the 13EMA blue 2 move down 2 price
MACD still racing downward
STOCH starting 2 break 20 line, Bulls want it 2 turn here while Bears want it 2 fully break below 20 line


$NASDAQ DAILY chart for Tuesday
So price following lower BB down since the trap door opened. Making a lower low
13EMA blue still pointing downward isn't good. That still shows they are averting the 13EMA blue from Bull crossing mid BB (yellow dash line)
MACD racing downward isn't good
STOCH also racing downward isn't good. Bulls really need it 2 turn before or at 20 line
$NVDA ER are over so I guess we see the real reaction tomorrow 🤔

6
321
$NASDAQ DAILY chart for Tuesday
So price following lower BB down since the trap door opened. Making a lower low
13EMA blue still pointing downward isn't good. That still shows they are averting the 13EMA blue from Bull crossing mid BB (yellow dash line)
MACD racing downward isn't good
STOCH also racing downward isn't good. Bulls really need it 2 turn before or at 20 line
$NVDA ER are over so I guess we see the real reaction tomorrow 🤔
$NASDAQ DAILY chart for Monday
Well, the signs were in Friday's daily chart 4 today's bloody red day! Price couldn't close over 13EMA blue 3 days in a row was the sign!🤓
Filled the black space below & opened the trap door lower BB (yellow arrow) is pointing down
13EMA blue pointing down & unable 2 Bull cross mid BB (yellow dash line) isn't good. Means the 13EMA blue/mid BB Bull cross is being averted
MACD gap widening & starting 2 break below the Tariff War MACD Low isn't good
STOCH turning before 50 dash line is bearish
All 👀 on $NVDA ER 2 save Bulls!

$NASDAQ DAILY chart for Monday
Well, the signs were in Friday's daily chart 4 today's bloody red day! Price couldn't close over 13EMA blue 3 days in a row was the sign!🤓
Filled the black space below & opened the trap door lower BB (yellow arrow) is pointing down
13EMA blue pointing down & unable 2 Bull cross mid BB (yellow dash line) isn't good. Means the 13EMA blue/mid BB Bull cross is being averted
MACD gap widening & starting 2 break below the Tariff War MACD Low isn't good
STOCH turning before 50 dash line is bearish
All 👀 on $NVDA ER 2 save Bulls!
$NASDAQ DAILY chart from Friday
Price did not close over 13EMA blue currently 25410 on Friday, so that's 3 times rejecting 13EMA & that is not a good sign. That is what Bulls need!
Price also closed below 200EMA green 25206. Bulls needed 2 regain it & hold it & it's not holding which isn't a good sign
Lots of black space 2 lower BB price could fill if wants if it can't regain that 13EMA blue
MACD gap still holding, Bulls really need that gap 2 close
STOCH still under 50 dash line, Bulls need 2 break above it

$NASDAQ DAILY chart from Friday
Price did not close over 13EMA blue currently 25410 on Friday, so that's 3 times rejecting 13EMA & that is not a good sign. That is what Bulls need!
Price also closed below 200EMA green 25206. Bulls needed 2 regain it & hold it & it's not holding which isn't a good sign
Lots of black space 2 lower BB price could fill if wants if it can't regain that 13EMA blue
MACD gap still holding, Bulls really need that gap 2 close
STOCH still under 50 dash line, Bulls need 2 break above it
solana:nasd9ZCaNtC3wZ4G7updmA48VGmcgyNnXsYQ6cRLkjP DAILY chart for Thursday
Well not too shabby price action with the "Jenson no longer CEO" news. Price still closed above 200EMA green but Bulls need 2 close over 13EMA blue 25456 soon
MACD turning here is good sign
STOCH really needs 2 race through 50 dash line, turning here would be bearish

solana:nasd9ZCaNtC3wZ4G7updmA48VGmcgyNnXsYQ6cRLkjP DAILY chart for Thursday
Well not too shabby price action with the "Jenson no longer CEO" news. Price still closed above 200EMA green but Bulls need 2 close over 13EMA blue 25456 soon
MACD turning here is good sign
STOCH really needs 2 race through 50 dash line, turning here would be bearish
$NASDAQ DAILY chart for Wednesday
Closed right below or at 13EMA blue 254714, also back above 200EMA green
Next resistance 2 regain is the mid BB (yellow dash line) 25807
Next cross is the 13EMA blue/mid BB Bull cross. Does it happen or do they avert it
MACD turning here is good
STOCH racing upward is good, needs 2 break above 50 dashline

$NASDAQ DAILY chart for Wednesday
Closed right below or at 13EMA blue 254714, also back above 200EMA green
Next resistance 2 regain is the mid BB (yellow dash line) 25807
Next cross is the 13EMA blue/mid BB Bull cross. Does it happen or do they avert it
MACD turning here is good
STOCH racing upward is good, needs 2 break above 50 dashline
$NASDAQ DAILY chart for Tuesday
Well price lost 200EMA green but not terribly. Bulls really need 2 regain it ASAP
Lower BB trap door still closed IMO, but a bad red day could reopen it
MACD like right at the Tariff War MACD Low, Bulls really need the MACD 2 turn here
STOCH is breaking above 20 line so that is a good sign, Bulls need it 2 race upward

Happy Veterans Day especially to my Dad, Grandpa & Great Grandpa!!! Thank you for your service! 🇺🇸🇺🇸🇺🇸

4
17
657
$NASDAQ DAILY chart for Tuesday
Well price lost 200EMA green but not terribly. Bulls really need 2 regain it ASAP
Lower BB trap door still closed IMO, but a bad red day could reopen it
MACD like right at the Tariff War MACD Low, Bulls really need the MACD 2 turn here
STOCH is breaking above 20 line so that is a good sign, Bulls need it 2 race upward
solana:nasd9ZCaNtC3wZ4G7updmA48VGmcgyNnXsYQ6cRLkjP DAILY chart for Monday
Price regained 200EMA green 25253 but Bulls need 2 hold above it on any close
Next resistance Bulls need 2 regain is the 13EMA blue
Lower BB closing trap door is a good sign
MACD turning at the Tariff War MACD Low is a good sign
STOCH still needs 2 break back above 20 line

solana:nasd9ZCaNtC3wZ4G7updmA48VGmcgyNnXsYQ6cRLkjP DAILY chart for Monday
Price regained 200EMA green 25253 but Bulls need 2 hold above it on any close
Next resistance Bulls need 2 regain is the 13EMA blue
Lower BB closing trap door is a good sign
MACD turning at the Tariff War MACD Low is a good sign
STOCH still needs 2 break back above 20 line
Thought I'd share what else I'm doing these days besides stonks. There's just something about the thrill of walking into a store & finding Needohs & Pokémon cards! And no I have not camped out, but I've waited in line once for a Needoh lol. Show me what you got!

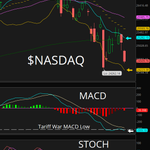
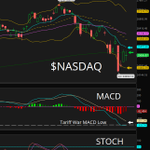
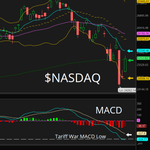
$NASDAQ DAILY chart for Bloody Thursday
One of the biggest bloody candles I've seen in a long time.
Opened gap down & just flushed through 200EMA green, out of lower BB, past July 29th low & almost 2 top of a Gap from April 16th
Reminds me of $NATGAS when they capitulate the big boys!
Price is well out of lower BB on the Daily & Weekly chart so its gonna have 2 get back within eventually
MACD broke through July MACD Low so I added the Tariff War MACD Low 2 gauge a reversal
STOCH holding below 20 line isn't good, Bulls need it 2 break back up through 20 line

$NASDAQ DAILY chart for Wednesday
Back tested 13EMA blue & rejected, Bulls want a close over 13EMA blue 25996
MACD possibly turning here right around July MACD low is good sign
STOCH lines crossed but still under 20 line, Bulls need it 2 break back over 20 line

$NASDAQ DAILY chart for Wednesday
Back tested 13EMA blue & rejected, Bulls want a close over 13EMA blue 25996
MACD possibly turning here right around July MACD low is good sign
STOCH lines crossed but still under 20 line, Bulls need it 2 break back over 20 line
$NASDAQ DAILY chart for Monday
Ugly day with price losing 200EMA green 25212
Lower BB pointing down is bad, price can just follow it down
13EMA blue pointing down is bad
MACD racing downward is bad, would be really bad if breaks through that July MACD low
STOCH rebraking 20 line is bad but Bears want it 2 fully break below 20 line

$NASDAQ DAILY chart for Monday
Ugly day with price losing 200EMA green 25212
Lower BB pointing down is bad, price can just follow it down
13EMA blue pointing down is bad
MACD racing downward is bad, would be really bad if breaks through that July MACD low
STOCH rebraking 20 line is bad but Bears want it 2 fully break below 20 line
$NASDAQ DAILY chart for Friday
Opened gap down below 25802 & followed lower BB down all the way down 2 the 200EMA green 25212 then bounced
So far 200EMA green holding as support, but will it next week
13EMA blue/50EMA purple Bull cross averted (shaded oval)
Lower BB pointing down isn't a good sign, still allows 4 more down side
MACD racing downward isn't good but still above the July MACD low (dash line)
STOCH holding below 50 dash line isn't good, breaking back below 20 line would be really Bearish

$NASDAQ DAILY chart for Friday
Opened gap down below 25802 & followed lower BB down all the way down 2 the 200EMA green 25212 then bounced
So far 200EMA green holding as support, but will it next week
13EMA blue/50EMA purple Bull cross averted (shaded oval)
Lower BB pointing down isn't a good sign, still allows 4 more down side
MACD racing downward isn't good but still above the July MACD low (dash line)
STOCH holding below 50 dash line isn't good, breaking back below 20 line would be really Bearish
$NASDAQ DAILY chart for Thursday
Today's price action helps avert the 13EMA blue/50EMA Bull cross (shaded oval)
Lower BB pointing down means door is open 4 price 2 go down more if wants
Breaking Low 25802 wouldn't be good, Bulls really need a higher low here
MACD keeping its gap wide and still racing downward isn't good
STOCH if turns here or before 50 dash line is bearish

$NASDAQ DAILY chart for Thursday
Today's price action helps avert the 13EMA blue/50EMA Bull cross (shaded oval)
Lower BB pointing down means door is open 4 price 2 go down more if wants
Breaking Low 25802 wouldn't be good, Bulls really need a higher low here
MACD keeping its gap wide and still racing downward isn't good
STOCH if turns here or before 50 dash line is bearish
$NASDAQ DAILY chart for Tuesday
Got the 13EMA blue back test & even back tested 50EMA purple but unable 2 close over both EMA
Another huge green day would help the 13EMA blue rapid recross 50EMA which is extremely bullish. The FOMC decision will help this rapid recross or avert it.
MACD fully crossing centerline isn't good but if it can turn here than that would be good
STOCH crossed and starting 2 break 20 line is good sign, needs 2 fully break above & race upward
It all depends on the reaction 2 the FOMC decision that's tomorrow.

$NASDAQ DAILY chart for Tuesday
Got the 13EMA blue back test & even back tested 50EMA purple but unable 2 close over both EMA
Another huge green day would help the 13EMA blue rapid recross 50EMA which is extremely bullish. The FOMC decision will help this rapid recross or avert it.
MACD fully crossing centerline isn't good but if it can turn here than that would be good
STOCH crossed and starting 2 break 20 line is good sign, needs 2 fully break above & race upward
It all depends on the reaction 2 the FOMC decision that's tomorrow.
$NASDAQ DAILY chart for Monday
13EMA blue/50EMA purple Bear cross happened, looks like Bears were trying 2 avert it but unable 2
Price still holding above last low 258025 which is good
MACD still racing across centerline isn't good sign
STOCH fully under 20 line isn't good
Could really go either way ...either back test 13EMA blue 26505 or test last low 25802

$NASDAQ DAILY chart for Monday
13EMA blue/50EMA purple Bear cross happened, looks like Bears were trying 2 avert it but unable 2
Price still holding above last low 258025 which is good
MACD still racing across centerline isn't good sign
STOCH fully under 20 line isn't good
Could really go either way ...either back test 13EMA blue 26505 or test last low 25802
$NASDAQ DAILY chart from Friday
Price following lower BB down
13EMA blue touching 50EMA purple, Bulls need some serious green days 2 still avert or minimize the 13EMA blue/50EMA purple Bear cross (shaded oval)
MACD racing across centerline isn't good
STOCH hanging around 20 line isn't good
