

Everything latent #psychometrics
Madrid
Joined January 2015
- Tweets3.7K
- Following439
- Followers555
- Likes3.4K







Marcos Jiménez retweeted

New paper on computerized adaptive testing using cognitive diagnosis models (CD-CAT) for small-scale assessments (N < 100). With the proposed procedures, students’ attribute mastery profiles can be assessed efficiently in classroom settings.
w/@MigSorrel
journals.sagepub.com/doi/10.…
Marcos Jiménez retweeted

📢 ¿Te interesa la Psicometría?
La Cátedra MAP (UAM) ofrece un contrato en prácticas de 12 meses (30h/semana, 1.111 €/mes).
+Info y solicitudes antes del 31/08/2025 👉 fuam.es/perfil-contratante/4…
Buena oportunidad para estudiantes @master_mccs
#psicometria #trabajo
Marcos Jiménez retweeted
📢 New publication alert!
We propose a general diagnostic framework for forced-choice (FC) assessments by adapting the G-DINA model.
Read it here 👉 bpspsychub.onlinelibrary.wil…
cc @NajeraPab

Marcos Jiménez retweeted

Aviso importante:
La conferencia ha cambiado de lugar.
Será en el SALÓN DE GRADOS ANGEL RIVIERE, a la misma hora.
Adjuntamos el anuncio correcto:

This quoted post is unavailable.
Marcos Jiménez retweeted
📢 Plaza en Metodología - @uam_psicologia: PAD042 (Programa María Goyri)
🗓️ Hasta 4/03/2025 | ❌ Excluidos ex-Ayudantes Doctores en universidades públicas 🇪🇸
Si te interesa o tienes dudas, ¡aquí estoy!
Info: uam.es/uam/convocatoria-uam2…

Marcos Jiménez retweeted
📰Paper out:
Equally vs. unequally keyed blocks in #forcedchoice questionnaires: Implications on validity and reliability tandfonline.com/doi/full/10.…
CC @muchapandi

Marcos Jiménez retweeted

Proud to share our latest publication with my dear colleague Alberto Maydeu-Olivares in Psychological Methods: Rediscovering the GFI to quantify the model’s utility in SEM, reporting the percentage of variance accounted for.
You can read it here:
psycnet.apa.org/record/2025-…

Marcos Jiménez retweeted

¡Hola, mundo!
Me llena de ilusión compartir con vosotros un proyecto que he finalizado tras dos largos años de trabajo. Os presento...
𝑨𝒏𝒂́𝒍𝒊𝒔𝒊𝒔 𝒅𝒆 𝒅𝒂𝒕𝒐𝒔 𝒄𝒐𝒏 𝑹 𝒆𝒏 𝑪𝒊𝒆𝒏𝒄𝒊𝒂𝒔 𝑺𝒐𝒄𝒊𝒂𝒍𝒆𝒔 𝒚 𝒅𝒆 𝒍𝒂 𝑺𝒂𝒍𝒖𝒅.
sintesis.com/libro/analisis-…

Marcos Jiménez retweeted

#methods people on Xwitter:
@SkeptPsych, Guilherme Wang, and I present to you our generalized approach to Bayessian Gaussian graphical models! From positive definite polychoric correlation matrices to model-based sparseness, we've got you covered 😎
advances.in/psychology/10.56…

Marcos Jiménez retweeted

Do you like Network Psychometrics, Structural Equation Modeling, & Confirmatory Factor Analysis? Have you ever wondered what to do if your bifactor model fits the data better than a correlated traits model, even when it shouldn't? Introducing: Generalized TEFI. Read more below...
Golino et al. (2021) developed a family of fit indices based on information/quantum information theory. The most accurate of them all is the Total Entropy Fit Index (TEFI).
The TEFI index computes the distance between the mean Von Neumann entropy (Von Neumann, 1927) of the dimensions (factors or communities) and the total entropy of the system of variables, and adds a penalization to the number of dimensions estimated.
This equation integrates three key components: the average entropy across dimensions or factors (A), the number of dimensions (B), and the total entropy of the system (C). The total entropy fit index can be re-written as TEFI = [P1] + [P2], in which [P1] = A and [P2] = (C − A) × √B. Golino et al. (2021) argues that [P1] is expected to decrease monotonically as the number of factors increases, but [P2] is expected to increase as the number of factors increase, representing the reduction in average entropy of a set of data conditional on a given dimensional (factor) structure. Finally, the square root of the number of factors was chosen in [P2] by Golino et al. (2021) to control the expected growth trajectory of [P2] as the number of factors increases. The effect of adding an additional factor would be conditional on the number of factors already being estimated in the model, showing a decreasing effect as the number of factors increases. In summary, TEFI computes the distance between the mean Von Neumann entropy of the dimensions (factors or communities) and the total entropy of the system of variables, and adds a penalization to the number of dimensions estimated.
The Generalized Total Entropy Fit Index
As can be noted by equation 3, TEFI can only be computed in single-level structures (e.g., those reflecting first-order factors or communities). At present, there’s no way for TEFI to take into consideration more complex dimensionality structures, such as bifactor structures with multiple correlated general factors. Expanding TEFI to accommodate dimensionality structures in two levels requires adding two new components to equation 3. One, [P3], representing the distance (or difference) between the sum of the Von Neumann entropy of the second-level dimensions, E, relative to (i.e., divided by) the number of first-level dimensions (first-order factors, group factors, first-order communities), B, and the total entropy of the system of variables (C). The other component to be added ([P4]), is similar to the penalization component [P2] of TEFI, but replaces A by E (the sum of the individual Von Neumann entropy of the second-level dimensions). The simplified version of The generalized total entropy fit index is, therefore:
GenTEFI = [ A + (C − A) × √B] + [ E + (C − E) × √B], or
GenTEFI = [P1] + [P2] + [P3] + [P4],
where
[P3] = (E/B) − C
and
[P4] = (C − E) × √B.
The generalized total entropy fit index can be seen as an additive fit index combining a first-order TEFI (TEFIFirst-Order = [P1] + [P2]) and a second-order TEFI (TEFISecond-Order = [P3] + [P4]).
The generalized TEFI can be, finally, formulated as:
Interesting Properties of The Generalized Total Entropy Fit Index
To demonstrate the applicability of the GenTEFI in comparing structures with varied organizations---such as correlated traits versus bifactor models---data were generated under two distinct conditions. In the first scenario, we generated data using a correlated traits structure, characterized by factor loadings between 0.45 and 0.75, correlations between factors ranging from 0.00 (orthogonal) to 0.70, and four variables per factor in a total of four factors. In the second scenario, the data was generated using a bifactor model comprising four group factors and one general factor, with four variables per group factor. Here, the loadings on the group factors varied from 0.45 to 0.55, while those on the general factors ranged from 0.45 to 0.70. For each model, we generated 100 datasets, each consisting of 5,000 observations, to robustly assess the characteristics of the GenTEFI (more specifically, the lower-order or first-order TEFI and the high-order or second-order TEFI values) across these different structural configurations.
The figure above is a hexagonal binning plot, and shows the relationship between factor loadings and the first and second-order TEFI under varying conditions of a correlated traits model. The use of hexagonal cells enables a clear depiction of data point density, with color gradients indicating the concentration of points---brighter yellow hues signifying greater densities.
The plot's facets correspond to different levels of interfactor correlation, ranging from orthogonal (zero correlation) to highly correlated factors, enabling a comparative analysis across the spectrum of loading magnitudes. The hexagons' borders are color-coded to denote the level of TEFI: red for second-order TEFI and gray for first-order TEFI (TEFI_{First-Order} = [P1]+[P2], TEFI_{Second-Order} = [P3]+[P4], see equation 4).
The figure reveals that, for orthogonal or weakly correlated trait structures, the first-order TEFI values are consistently lower than those of the second-order meaning the *uncertainty* of the correlated traits structure is *lower* than the bifactor structure.
The first-order TEFI was computed in a structure that mirrors the true four-factor model whereas the second-order TEFI is based on an assumed but incorrect higher-order factor.
Interestingly, as interfactor correlations strengthen, the gap between first and second-order TEFI narrows. At higher interfactor correlations, the second-order TEFI becomes less than the first-order, suggesting an emergent second-order structure.
These observations underscore two key insights regarding the GenTEFI: its sensitivity to distinguishing between correlated traits and bifactor or hierarchical structures and its responsiveness to changes in the correlation between factors, which reflects different organizational complexities within the data structure. As the correlation increases, more information is being shared between the factors, which makes them more mixed or presents a higher disorganization and higher uncertainty. As in physical systems, systems of variables with mixed states show a higher entropy, disorganization, or uncertainty than systems well-compartmentalized into distinct sets. Consequently, with increased correlations between factors, the overall system of variables has a higher entropy or uncertainty than the average entropy of its individual factors. This suggests that the global interactions of the variables contribute more to its entropy than the internal structure of its factors. Consequently, the uncertainty of a hypothetical second-order factor decreases. In other words, as the correlations between factors increase, a second-order structure emerges.
In Figure the figure above, a hexagonal binning plot shows the relationship between factor loadings and the Total Entropy Fit Index (TEFI) under varying conditions of a bifactor model. Loadings of the general factors are represented in the x-axis, and the grid represent different magnitude of the first-order factor loadings (or loadings of the group factors). The plot indicates that the values for second-order TEFI are lower than for the first-order ones, and this gap grows as the general factors' loadings increase. This distinction between the first and second-order TEFI values highlights the usefulness of the `GenTEFI`. In short, both Figures illustrate that `GenTEFI` is an effective new tool for analyzing the dimensionality of psychology data---it helps differentiate between a correlated traits model and a bifactor model.
When the underlying structure of the data is a correlated traits model, first-order TEFI values are smaller (more negative) than second-order ones.
Interested in learning more? Check our our pre-print:
Golino, H., Jiménez, M., Garrido, L. E., & Christensen, A. P. (2024, March 19). Generalized Total Entropy Fit Index: A new fit index to compare bifactor and correlated factor structures in SEM and network psychometrics. doi.org/10.31234/osf.io/5g3h…


Marcos Jiménez retweeted
New Pre-Print: "Generalized Total Entropy Fit Index: A new fit index to compare bifactor and correlated factor structures in SEM and network psychometrics" (link in the comments), by Golino, Jimenez, Garrido, & Christensen. Read the extended summary below.
Bifactor models are popular but beware of bias in fit indices. Recent studies show that traditional indices (like CFI, RMSEA) may favor bifactor over correlated traits models, even if the true data generation mechanism is a correlated traits model. This affects model selection and interpretation in psychology research.
Recent research by Kan et al. (2024) warns against using approximate fit indices like CFI and RMSEA when comparing models, as they may favor more complex bifactor models. They suggest using relative fit indices such as BIC and AIC instead. Usually, to address potential bias in bifactor models, researchers are urged to consider a broader range of factors beyond fit indices, including theory and factor interpretability. However, the field has largely avoided directly addressing the limitations of traditional fit indices, either by advocating for a more comprehensive approach or by avoiding bifactor models altogether. This highlights a significant gap in the field and the need for new fit indices that are not based on traditional covariance matrix comparisons.
# Limitations of Recent Simulation Studies
Recent studies investigating fit indices for comparing correlated traits and bifactor models have faced limitations in their approach. Cudeck and Henly (1991) identified four critical types of discrepancy in statistical modeling: Discrepancy due to Approximation (DA), Discrepancy due to Estimation (DE), Sample Discrepancy (SD), and Overall Discrepancy (OD). However, research by Greene et al. (2019), Morgan et al. (2015), Bonifay and Cai (2017), and Kan et al. (2024) has predominantly focused on generalizability (minimizing OD) without adequately addressing verisimilitude (minimizing DA). This narrow focus potentially overlooks crucial aspects of model performance, particularly when examining various sample sizes. Furthermore, these studies have not incorporated error at the population level in their simulations, limiting their ability to capture realistic evidence of both estimation-based and approximation-based divergence. A more comprehensive approach to evaluating fit indices in bifactor modeling should consider both generalizability and verisimilitude, while also incorporating population-level error to provide a more accurate representation of real-world scenarios.
# Present Study:
This paper introduces the generalized total entropy fit index (GenTEFI), an extension of the total entropy fit index (TEFI) developed by Golino et al. (2021). While TEFI showed high power in detecting correct population structures, it was limited to single-level structures. GenTEFI expands this capability to accommodate more complex two-level structures, including bifactor models with multiple general factors. In the paper we implemented three simulation studies to address limitations in recent research by generating data from population models with error, allowing for the quantification of fit indices' accuracy in capturing both sampling and approximation discrepancies. These simulations compare GenTEFI's performance against traditional fit indices at both sample and population levels, with a focus on differentiating between correlated traits and bifactor structures under various data generation mechanisms.
Simulation 1: True data generation mechanism: correlated traits model with population error.
Simulation 2: True data generation mechanism: bifactor model with population error.
Simulation 3: True data generation mechanism: bifactor model with population error, comparing the correct structure to over- or under-factored structures.
# Results:
The study's results demonstrate that the Generalized Total Entropy Fit Index (GenTEFI) is the most effective measure for distinguishing between correlated traits and bifactor structures, both at the population and sample levels, regardless of the true data generation mechanism. GenTEFI showed a balanced accuracy of 94-95% across all tested conditions, outperforming other indices such as BIC, AIC, RMSEA, and SRMR. While BIC and AIC performed well at the sample level, they struggled at the population level, indicating poor capacity to detect Discrepancy due to Approximation (DA). GenTEFI proved particularly effective when the data generation mechanism was a correlated traits model, though it showed some limitations with high loadings, moderate factor correlations, and fewer items per factor.
Balanced Accuracy (Simulation 1):
# Hit Rate (Percent Correct) Simulation 1:
# Hit Rate (Percent Correct) Simulation 2:
The second simulation compared bifactor structures (reflecting the true data generating mechanism) with correlated traits structures. It is well known that traditional fit indices have a bias towards bifactor models, and therefore it is expected that in the second simulation these fit indices perform well.
At the population level, BIC, AIC, CFI, RMSEA, and SRMR achieved the highest mean percent correct (100%) for both lower and higher population error. GenTEFI had a mean percentage correct of 95.83% for both error levels at the population.
At the sample level, CFI, AIC, and SRMR presented a mean percentage of 100% for higher and lower population error, respectively, while RMSEA presented percent correct scores of 99.98% and 100%, for higher and lower error. BIC presented percent correct scores of 95.23% and 95.94%, for higher and lower population errors, while GenTEFI presented percent correct scores of 93.98% and 94.46%.
In the second simulation, with a true data generation mechanism being a bifactor model, all fit indices presented a high or very high accuracy for the population and sample levels. This indicates that all fit indices are good at capturing DE, DA, and OD when the true data generation mechanism is a bifactor model.
# Hit Rate (Percent Correct) Simulation 3:
In the third simulation, which compared correct bifactor structures to misspecified ones, RMSEA emerged as the most accurate index, with all fit indices showing high accuracy (80% or above at the population level and over 90% at the sample level). GenTEFI, BIC, and RMSEA performed particularly well in identifying overfactored general factor structures, especially with moderate loadings on the general factor. Based on these findings, the researchers recommend using GenTEFI as the primary metric for deciding between correlated traits and bifactor models. If GenTEFI suggests a bifactor model, traditional fit indices like RMSEA and BIC can be used in combination with GenTEFI to determine the most appropriate structure among competing bifactor models.
# Empirical Example 1:
We analyzed data from the 12-item Experiences in Close Relationships (ECR-12; Lafontaine et al., 2015)scale to compare the fit of a correlated-factors model against a bifactor model. The ECR-12 is purported to measure two attachment factors, anxiety and avoidance, each measured by six items. In general, the ECR published literature has not considered a bifactor model of attachment for the responses to this scale. The data was obtained from the Open Source Psychometrics Project (), which contained full responses by 27,883 persons from the United States.
The items were responded via a 5-point Likert scale with options strongly disagree (1), disagree (2), neither agree nor disagree (3), agree (4), and strongly agree (5). Cronbach’s alpha reliability was .858 for avoidance and .840 for anxiety.
The factor models were estimated using robust maximum likelihood. The two-factor CFA model produced a good fit to the data with CFI = 0.95, RMSEA = 0.07, and SRMR = 0.05. Additionally, AIC = 1,825,558.68 and BIC = 1,825,558.68 for this model. The standardized loadings on the avoidance factor ranged from .54 to .80 (M = .70), while the loadings on the anxiety factor ranged from .50 to .79 (M = .6785). The two attachment factors were estimated to be approximately orthogonal, with a correlation of -0.002.
The bifactor model produced an even better fit to the data according to all factor-analytic fit indices, with CFI = 0.97, RMSEA = 0.05, and SRMR = 0.03, AIC = 1,819,293.09, and BIC = 1,819,293.09 for this model.
However, the standardized loadings did not support this bifactor structure as none item of the avoidance dimension had loadings above .12 on the general factor (M = -0.01), while the anxiety items had a mean loading of .67 on it. Conversely, the anxiety items did not load on the anxiety group factor well with a mean loading of -0.13, while the avoidance items had a large mean loading of .70 on the avoidance group factor.
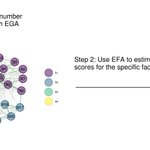
When Exploratory Graph Analysis in the ECR data, the two-dimensional structure of the avoidance and anxiety items became very clear (see Figure above).
The generalized total entropy fit results point to the first-order two-community structure with avoidance and anxiety factors (TEFIfirst−order = -9.74) as fitting better than the bifactor structure with a general factor (TEFIsecond−order = -6.22).
The lower TEFI value for the first-order structure, compared to the second-order TEFI value, indicates that a two-community structure presents a lower level of disorganization, fitting the data better.
# Importance of the Empirical Example 1:
The two-factor structure aligns closely with attachment theory as developed by Bowlby and Ainsworth. This theory conceptualizes attachment in terms of anxiety about abandonment and avoidance of intimacy. Lafontaine et al. (2015) points that the two-dimensional factor structure of the ECR has been observed consistently across various populations, cultures, and languages. This robust replication supports the validity of the two-factor model. The paper emphasizes that anxiety and avoidance are designed to be orthogonal (uncorrelated) dimensions. This independence is theoretically important and has been supported by research, although small correlations are sometimes observed. Therefore, a bifactor model does not make theoretical sense, although it is shown to fit the data better than a correlated-traits structure with two factors, according to the traditional indices (CFI, RMSEA, SRMR, AIC, and BIC). The new Generalized Total Entropy Fit index, on the other hand, identified the two-factor structure as fitting the data better than the bifactor structure.


Marcos Jiménez retweeted

The 2nd Individual Differences talk is “Cognitive reflection is a better predictor of metacognition than actual task performance” by Vithor Franco @vthorrf & Marcos Jiménez @SkeptPsych
mathpsych.org/presentation/1…
#iccmpsyched
Marcos Jiménez retweeted
In two weeks, Prof. Jimmy de la Torre and I will be at @ITC2024Granada teaching a short course on cognitive diagnosis modeling. We are looking forward to what will be a theoretical and practical introduction to these fresh models for educational and psychological testing

👨🏫 Check the abstract for the short course that #JimmydelaTorre and #PabloNájera @NajeraPab will give in the 2024 ITC Conference: bit.ly/46lEniX
You can also consult their bios here: bit.ly/47z0RxS

Marcos Jiménez retweeted
New paper alert: Revised Network Loadings, by Christensen, Golino, Abad, and Garrido (2024). We've significantly improved our network loadings. If you're interested in network psychometrics and exploratory graph analysis, give it a read!
This Post is from a suspended account. Learn more
Marcos Jiménez retweeted
Hi peeps!
@MorHeene, @bendomingue, @SkeptPsych, and I wrote an uncomplicated introduction to representational measurement theory (RMT).
You can read the preprint here: osf.io/preprints/psyarxiv/cm…
1/3
Marcos Jiménez retweeted
Mauricio Garnier-Villarreal impartirá el seminario sobre Ecuaciones Estructurales Bayesianas en R (BSEM) el día 10 de abril 1 las 13:00 en la UAM.
+info: eventos.uam.es/114954/detail…

Marcos Jiménez retweeted
What a duo! Don’t miss this opportunity to learn about cognitive diagnosis modeling aka item response theory for discrete latent variables
👨🏫 Check the abstract for the short course that #JimmydelaTorre and #PabloNájera @NajeraPab will give in the 2024 ITC Conference: bit.ly/46lEniX
You can also consult their bios here: bit.ly/47z0RxS
Marcos Jiménez retweeted

¡¡ Muchas gracias !! 😄😄Es una alegría y un propulsor recibir la ayuda de la @_AEMCCO_ para desarrollar durante este año el proyecto de los #premiosAEMCCO2023🚀.
¡Por supuesto! Os cuento brevemente, sin spoilers😉, de que va el proyecto... ¡Dentro hilo! 🧵


¡¡Desde AEMCCO nos volvemos a sumar a las felicitaciones!! 🥳🎉 Es alentador ver que cada año se presentan proyectos realmente interesantes. Quizás, aprovechando que @diegoiglesias_ esta por aquí 😉, nos puede hacer un 🧵-resumen de su proyecto 🙏. #premiosAEMCCO2023