MapTheClouds (@maptheclouds) header
MapTheClouds (@maptheclouds) profile picture

Webdev and cartographer, on a journey to 3Dmaps and dataviz. Grab a coffee and buckle up, we're going to map the clouds! 🌩️ 🏞️ 🌩️

Joined January 2019
Photo by MapTheClouds (@maptheclouds)Photo by MapTheClouds (@maptheclouds)Photo by MapTheClouds (@maptheclouds)Photo by MapTheClouds (@maptheclouds)Photo by MapTheClouds (@maptheclouds)Photo by MapTheClouds (@maptheclouds)Photo by MapTheClouds (@maptheclouds)Photo by MapTheClouds (@maptheclouds)Photo by MapTheClouds (@maptheclouds)Photo by MapTheClouds (@maptheclouds)
Open City · Day 7/30 · 10 minute map 🏘️ One click, "View neighbours": where does Cluj-Napoca end? On paper, at a 92 km border; 13.6 km of it is built on both sides. 3D map, MapLibre + Three.js. Inspired by Robin Hawkes. What's around your city? #30DayMapChallenge #3DMaps
1
23
Open City · Day 6/30 · Vintage 🗺️ Cluj in 1955, drawn again from its own map. The paper burns open on today. A window on today's map shows 1955: tree rows, a few houses, a field; today, blocks. Inspired by @vcraciunescu. What was there before your neighbourhood? #30DayMapChallenge #ThreeJS
7
227
Open City · Day 5/30 · Senses: Sight ☀️ From Cetățuia you see a fifth of Cluj (~35 km², estimated), and the day is 13 minutes shorter than on a flat horizon: the same hills hide the sun. How much of your city can you see from your hill? #30DayMapChallenge #ThreeJS
4
11
319
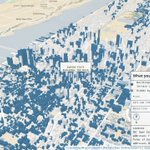
Day 5, second story: from the Empire State's 86th floor, about a tenth of Manhattan is in view, and Central Park is nine-tenths hidden behind the towers. #Manhattan #NYC
1
76
Open City · Day 4/30 · Clusters 🧭 911 places in 77 ha: the center of Cluj-Napoca, Romania. 72% of residents reach 6 of 8 kinds of service in a 10-min walk (estimated). Deepest gap: Cordoș, a ~35 min walk to a doctor. Inspired by @milan_janosov #30DayMapChallenge #ThreeJS
2
6
359
Day 4, second story: Manhattan. Its places peak in Chinatown and the Lower East Side, about 1,800 per km²; the largest knot, the Upper West Side, holds 1,399 places (OpenStreetMap, estimated density). #Manhattan #NYC
70
Open City · Day 3/30 · Polygons 🏙️ In 1975, the hills of Borhanci were not yet built. Day 3 of #30DayMapChallenge: Cluj-Napoca grows hectare by hectare. The city built after 1975 climbed almost 40 m higher, and 1 in 3 people there lives over 300 m from a stop (1 in 7 in the old city). Inspired by Alexander Bogachev. Data: estimated (satellite model) #3DMaps #ThreeJS #MapLibre
1
20
651
Day 3, second story: Manhattan, building by building, each footprint in the year it was built (NYC Open Data, 98.2% dated). #Manhattan #NYC
47
Open City · Day 2/30 · Lines 🚋 A line on a map is a route someone takes. Day 2 of #30DayMapChallenge: tram 100 ridden across Cluj-Napoca, from Piața Gării, the railway station square, to Bulevardul Muncii. Then the whole network appears: 72 lines and 438 stops, drawn by volunteers in OpenStreetMap. Inspired by @underdarkGIS (Anita Graser), who reads a line as a journey before a shape. Data: mapped (OpenStreetMap) · relief estimated #3DMaps #MapLibre #ThreeJS
3
28
1,090
Day 2, second story: Manhattan. 365 transit lines and 1,003 stops in OpenStreetMap, much of it beneath the streets. #Manhattan #NYC
92
Open City · Day 1/30 · Points 🌳 A tree can be right outside your window and still be missing from the map. Day 1 of #30DayMapChallenge: the trees of Cluj-Napoca leaf out at the pace people added them to OpenStreetMap. 5,881 so far; 2,250 were added in 2022 alone. Inspired by @CraigTaylorViz and his 2019 animation of New York's trees, raining down in the order they were added to the data. Is there a tree near you still missing from OpenStreetMap? #3DMaps #ThreeJS
3
3
39
1,832
Day 1, second story: Manhattan. NYC Parks lists 98,685 street trees in 449 species. Inside Central Park the register has only 170: the Conservancy cares for over 18,000. #Manhattan #NYC
113
#30DayMapChallenge starts tomorrow. 🎉 I can't wait to see the maps you'll make. I'm sure this year will bring an explosion of imagination. 🙂 Happy mapping! 🗺️ #3DMaps
1
7
362
Every map I make stands on someone else's work. With a few secret ingredients of my own. 🗺️ This Sunday, #30DayMapChallenge begins, and my theme is a thank-you. Following FOSS4G Bucharest live in 2019 showed me how freely this community shares code, data and maps. Thirty days, thirty layers of Cluj-Napoca in 3D, from open data only, each with the person who inspired it. Whose work inspires yours? #3DMaps
1
3
685
MapTheClouds retweeted
Made a city generator using procedural buildings and materials/textures using TSL only. github.com/mrdoob/three.js/p…
26
26
5
371
14,737
MapTheClouds retweeted
Three.js Paris conf tickets are LIVE! Grab your early bird ticket for a huge discount. 👉 threejs.paris/tickets
7
20
1
313
21,138
February 9 → May 19, 2026. 100 consecutive days of showing up. Not 100 perfect maps, but 100 days of building in public: from GIS foundations to browser-native 3D, client delivery, and experimental spatial systems. 🔗 Interactive calendar (each tile opens its LinkedIn post): maptheclouds.com/100-day-map… What became clearest is what I want next: spatial tools that genuinely help people navigate real-world decisions, in Cluj and beyond. Maps as portals and instruments, not as an escape from the world outside the screen. The arc is complete. I'm shifting focus back to architecture, delivery, and selective collaborations on enterprise spatial platforms, high-performance 3D visualisation, and interactive mapping systems where technical rigour and visual clarity both matter. If that sounds close to your roadmap, let's talk. 📩 [email protected] 🌍 maptheclouds.com DM welcome. Thank you to everyone who followed this journey. 🚀 #100DayMapChallenge #CampaignComplete #SpatialEngineering #Geospatial #DataVisualization #ThreeJS #WebGL #MapLibreGL #OpenForWork #GISConsulting #GIS #Cluj
1
1
17
1,591
Day 100. Silent Moon 🌘 When Artemis II carried four humans around the far side of the Moon again, the story was easy to follow, but the trajectory still felt abstract in my head. I started building Silent Moon as a browser scene where the mission path stays readable in motion instead of collapsing into a decorative curve. The initial version focused on clarity: one continuous trajectory from real orbital vector context, stable phase markers, and labels that hold up while the camera moves. From there, scroll-driven narrative, camera locking between Moon, Earth, and Orion, and continuous tracking so navigation does not snap you out of the mission thread. Later iterations added atmosphere: clearer Earth and Moon textures, a subtle glow layer, a denser star field, and tuned trajectory contrast for dark space. ✨ Stack: React, Three.js, React Three Fiber, and Drei, with shader work where lighting stays physically coherent. Still a work in progress, but the clearest articulation so far of how I want to connect geospatial craft to cinematic mission storytelling without losing engineering honesty. 🚀 Day 100. Campaign complete. 🌍 100 consecutive days of showing up, shipping work, and building in public. Thank you for following this journey. The work continues. ❤️ #100DayMapChallenge Day 100/100 #3DMaps #Artemis #ThreeJS #WebGL #SpaceExploration #DataStorytelling #DataVisualization #Animation #Geospatial #NASA #ReactThreeFiber #Interactive3D #MapTheClouds #CampaignComplete
3
336