

Weekly trend-phase read on indexes, BTC, ETH and FX. What the chart shows, after the bar closes. Educational only.
Joined October 2026
- Tweets38
- Following9
- Followers2
- Likes0






Pinned Tweet
How to read a chart
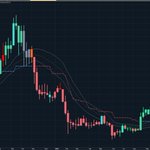
The dotted line is the overall trend. When it sits below the bars and is blue, the trend is bullish. When it sits above the bars and is red, the trend is bearish. “The line flipped red” (or blue) means the trend changed on a closed bar.

5
31


QQQ weekly, Yahoo (w/e Nov 13): the downtrend of recent weeks continued. Bearish weekly reading again, and the long-term trend still bearish since Oct 30.
Educational only. Not a recommendation to buy or sell any security. $QQQ
3
Last week's bearish readings on QQQ and SPY's bars carried on this week, and the SPY and SOL lines flipped red. BTC and HYPE show pullbacks within longer-term uptrends. XMR, a privacy coin, is the exception, still in an uptrend since about Aug.
1
7
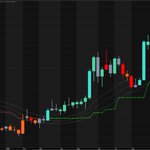
HYPEUSD weekly, Yahoo (w/e Nov 8): red bar this week after last week's bounce, a pullback within the longer-term uptrend. The line is still green, in place since mid-Mar. Educational only. Not a recommendation to buy or sell any security. $HYPE

1
2
XMRUSD weekly, Yahoo (w/e Nov 8): the odd one out. XMR, a privacy coin, still has a green line (since about Aug) and a grey bar this week, while the other coins here printed red. Educational only. Not a recommendation to buy or sell any security. $XMR

2
