


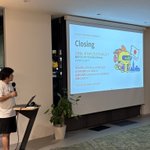

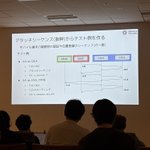


今日の発表資料をアップロードしました。
Grafanaをつかって、あちこちに散らばっているデータを一箇所で確認できるようにするお話をしました。
speakerdeck.com/mtanda/growi…
#cndw2026

今年のGrafana Advent Calendar一日目の記事で、
Agent o11yのlocal modeを使って、手元でさっとコーディングエージェントのコストを可視化する方法を紹介します。
qiita.com/advent-calendar/20…

mtanda retweeted

子育て中のGrafanaメンバーのnote
育児記録アプリ「ぴよログ」のデータを Grafana Cloud で可視化してみた 🐣
note.com/grafana_jp/n/neddfa…

speakerdeck.com/takehaya/kot…
> つまるところvirtual threadのフリをさせたJavaAgentを作りさえすれば、コルーチン対応はOBIを無改造で実現できる!
これでいけそうと思いつくところも、実装までやってしまえるところもすごい。 #kotlinfest

mtanda retweeted

KotlinFestで本日1400から「eBPF Tracing for Kotlin」というタイトルで発表します!ぜひご覧ください!!
eBPFでKotlinを愛でていきたいなと思います!💕
speakerdeck.com/takehaya/kot…
#kotlinfest

mtanda retweeted

This is huge. Probably the biggest realization for open-source @CloudNativeFdn metrics this year.
🔥 Scraping 345,000 active @PrometheusIO series every 15s and sending via Remote Write 2 or @opentelemetry OTLP takes on modern @golang collectors:
• ~1 GiB of RAM (WSS) with ups & downs (WAL compaction, cardinality bumps)
🚀 With @rustlang and @ApacheArrow via @opentelemetry otel-arrow using our new Prometheus scrape.rs crates:
• ~30 MiB of RAM (WSS, 5 MiB live heap)
• 2.6x–7.3x less CPU, flat for 23 hours 😱
I couldn't believe it. How is this even physically possible?
We have an opportunity to save $2.5B–$4B/yr in collector compute globally, and easily $100M+/yr at single-hyperscaler scale. We can scale 30x per pod, get hardware back, and deprioritize complex scalability band-aids like DaemonSet VPA and sharding.
Yes, I wrote the @OReillyMedia "Efficient Go" book, but for the last 2 weeks I've been becoming a Rust and columnar developer. There is no other way. This is the way.
And yes, we are starting a Prometheus.rs (ecosystem-wide) SIG — see #prometheus-rs-sig on CNCF Slack!
Huge thanks to the OpenTelemetry otel-arrow community for doing most of the work, Laurent Quérel for consulting, and the @ThanosMetrics & @PrometheusIO communities for columnar inspirations 💪
(Disclaimer: early numbers without full parity yet—with staleness, relabeling, and K8s discovery, compute needs will grow. Still, starting at 30 MiB WSS gives us tons of room!)

mtanda retweeted

CloudNative Days Winterに参加される方は下記調査を実施してそのスクショを持ってGrafana Labsブースに来てもらえるといいことあります! #cndw2026 #grafanajp

Grafana Labsでオブザーバビリティに関する調査を実施しています!ぜひご協力ください! #observability #grafanajp
grafana.com/observability-su…

mtanda retweeted
Grafana Labsでオブザーバビリティに関する調査を実施しています!ぜひご協力ください! #observability #grafanajp
grafana.com/observability-su…
ISUCONでGrafanaを使ってくださった方が、参加レポートを書いてくださっている。
Pyroscopeが活躍するような場面もあったようで、こういったところで活用していただいて、とてもうれしい。
4
209
mtanda retweeted

めっちゃ最高の監視基盤でした、ハーネスやっていき!
>自宅のクラスタにGrafanaなどの監視基盤を用意し、競技サーバーからデータを送る形にしました
o11y基盤とAIで戦ったISUCON2026参加記(126,634点・126位)|Lapi zenn.dev/tokium_dev/articles… #zenn

mtanda retweeted

だいぶ遅くなりましたが、参加ブログを書きました。
運営の方々ありがとうございました!
天体可観測はISUCON2026に参加しましたzenn.dev/celestial_o11y/arti… #zenn #isucon #isucon2026

私も、こちらのイベントに参加させていただきます!
AIによるインシデント対応を支える Grafana Cloud の Knowledge Graph という機能についてお話しします。
ぜひご参加ください!

Grafanaの新日本拠点でイベントを開催します!!ぜひお越しください。
incidentlake-ug.connpass.com…

mtanda retweeted

『Observability Conference Tokyo 2027』の開催が決定しました!🎉
📅 2027年11月5日(金) 📍 東京・中野
約1年後の開催となりますが、まずはぜひカレンダーの確保をお願いします📆✨ 続報もお楽しみに!
o11ycon.jp
#o11yconjp

mtanda retweeted

eBPF Japan Meetup #8 も、ここでしか聞けないディープな話題で大いに盛り上がりました! 当日の発表資料のリンクをいただいたので、次回以降の参加を検討されている方も、ぜひチェックしてみてください! #ebpf #ebpfjp ebpf.connpass.com/event/4045…


「Cloud Native Community Japan - eBPF Japan Meetup #8」いよいよ11/6(金)開催!今回はさくらインターネット株式会社様の東京支社からお届けします!eBPFのさまざまな可能性を楽しめる内容となっています。 皆さまのご参加をお待ちしています!
ocgroups.dev/cncf/group/bqd9…
#CNCJ #ebpfjp

ドキュメントでは明記されていないが、Grafana AlloyにはOpenTelemetry eBPF Profilerが組み込まれているので、Alloyを導入済みであれば、設定変更だけで導入できる。
grafana.com/docs/pyroscope/l…

OpenTelemetry eBPF Profilerが集めたデータの出力先としてPyroscope以外にないのかと確認したら、Elasticsearchでも対応していた。
プロファイルのシグナル自体がAlphaの段階ということもあって、他のシグナルほどサポートが進んでいないだけのようだ。
elastic.co/observability-lab…

本日のeBPF Japan Meetupでの発表資料です。
前回のOBIにつづけて、OpenTelemetry eBPF Profilerの話をします。
speakerdeck.com/mtanda/otel-…
#ebpfjp

mtanda retweeted
IaCがなぜ無くならないか書いたので公開した
ymotongpoo.hatenablog.com/en…

