





Nerdmond retweeted

BREAKING: Nvidia, $NVDA, CEO Jensen Huang has resigned as CEO, President, and member of the Board of Directors, effective immediately.

Nerdmond retweeted

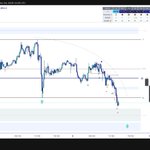
Is $SUI almost bottomed? 📈
Price didn't deviate the range low, so liquidity is clearly resting below it.
I'm watching for manipulation below the range low, with Wyckoff confirmations after the liquidity has been taken.
On the HTF, I'm watching the weekly and 6D candle formation.
🪄


Nerdmond retweeted

Tradingview isn't getting enough hate for being absolute shit the last 7 days. Between the awful UI update on the mobile app to dysfunctional freezing and data bugs.
Nerdmond retweeted

Don't worry, I'm sure tech billionaire Jensen Huang having an intimate relationship with a Chinese spy is just an isolated incidence...


Nerdmond retweeted

Abbott Laboratories(Pharmaceutical Stoke). Currently is accumulating close to the ATH area ( ATH December 21 on Covid) made an inducement to the ATH.
Narrative : An ageing global population + increasing chronic diseases + demand for advanced medical technology+ Diabetes Growth


Nerdmond retweeted
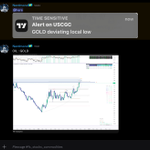
GOLD / #XAUUSD HTF
This is exactly what you want to see for a bottom creation 📈
Price deviated the HTF range low, with immediate acceptance back inside the range.
I'll be pressing buttons if the structure demand gives the 3d tap confirmation.
Watching for shorts at the mapped out supply zone.
Big potential.




Nerdmond retweeted
$BTC and $USDT.D HTF
Liquidity resting below the 75k low. Price is clearly trending downwards and created a new range which doesn't look very promising yet from a long perspective.
My preferred areas to watch for longs will be the liquidity below the 75k low, and the hidden orderblocks below the daily UNF candle at 72k.


Nerdmond retweeted

BOJAN HIGHS & LOWS.
THE HIDDEN ACCUMULATION & DISTRIBUTION V14
Most traders see a high or a low and candles on the chart, resistance, breakout, or reversal. But they miss the obvious
But the real opportunity often develops when price moves beyond an obvious level, takes the liquidity resting there, and fails to sustain the breakout.
This is where I use Bojan highs and lows as confluence. That's where a high probability Bojan forms.
THE FORMATION
A Bojan is not simply random wicks. It is a specific candle formation I use to identify potential rejection at a structural turning point. Accumulations or distributions
The focus is on three elements
1. The Open Where the expansion begins.
2. The Wick The sweep into liquidity and rejection from the extreme.
3. The Third Close The confirmation that price has rejected the move.
A Bojan Low can reveal a potential shift after aggressive selling and a sweep beneath liquidity.
A Bojan High can reveal the opposite price takes the highs, attracts breakout buyers, and fails to sustain the move.
But the formation alone is not enough. Its location determines its importance.
THE WYCKOFF CONNECTION
In reality, a bojan high & low is just an wyckoff accumulation & distribution. A 15-30-1H bojan high might have a 1-3-5m wyckoff ditribution within the 3 candles.
But even inside textbook wyckoff schematics you can use Bojan highs&Lows as confluence
Think about a Wyckoff accumulation.
Price approaches the range low, sweeps liquidity beneath it, and forms a potential Bojan Low during the Spring or its LPS.
Instead of guessing where the bottom is, you wait for the formation and its confirmation. If the market subsequently shifts structure and shows demand, you have multiple factors supporting the same idea.
The distribution scenario is the opposite.
Price approaches range resistance, sweeps the highs, and forms a Bojan High during a potential UTAD or near an LPSY. Late breakout buyers are trapped, and the subsequent weakness can provide the confirmation needed to consider a short.
The Bojan helps refine the execution. The Wyckoff structure explains the context. 1/2


THE BIGGER PICTURE. CONFLUENCES.
FIBONACCI V13
Fibonacci is not a strategy. It is a tool for measuring potential retracements, expansions, and time-based inflection points.
The real value isn't in the numbers themselves. It's in where they align with the story price is already telling.
A Fib level in the middle of nowhere means very little. A Fib level inside a strong demand zone, near a liquidity pool, or just above a significant high can add another layer of confluence to an already valid setup.
This is how I use it.
PRICE RETRACEMENTS
When price returns to a strong supply or demand zone, I look at how the Fib levels interact with that area.
Does the 0.5, 0.618, or 0.786 retracement overlap with the zone? Is liquidity resting nearby? Does market structure support a reaction?
The Fib doesn't make the zone strong. The zone earns its importance through structure, displacement, and context. The Fib simply adds another point of agreement.
EXPANSION & NEGATIVE FIBS
When a valid structure forms, I can use negative Fib extensions to project potential expansion targets.
My structural reference uses two consecutive candles in one direction, followed by two in the opposite direction, then two in the original direction. Inside bars don't count.
From there, I measure the swing low to swing high and watch extensions such as -0.5, -0.618, and -1.0.
These levels become potential target zones, not guaranteed destinations.
If a draw on liquidity sits just above a high or below a low, that liquidity takes priority over the Fib projection. The level helps frame the move, but the market's structure and available liquidity determine what matters most but the fib in the right place consolidates that thesis.
TIME IS ANOTHER DIMENSION
Most traders measure price. Fewer examine time.
Fibonacci time counts, such as 21, 34, 55, or longer sequences, can help identify windows worth watching for a potential shift in market behavior.
A time count alone does not predict a reversal. But when a time window aligns with a significant supply or demand zone, a liquidity event, and a meaningful structural level, it gives you another reason to pay attention.
The objective isn't to predict the exact candle. It's to recognize when several independent factors converge.
THE PRINCIPLE
A strong demand zone tells you where buyers may respond.
A liquidity pool tells you where price may be drawn.
A Fib level adds another reference point.
Time can help frame when a reaction may become relevant.
Structure and confirmation tell you whether the opportunity is actually developing.
Each piece has a purpose. None is sufficient on its own.
Stop treating Fibonacci as a collection of magical numbers. Treat it as another instrument for measuring the market, refining your zones, and building a more complete picture.
Confluence is not about collecting as many lines as possible. It is about finding meaningful agreement between factors that matter.
Yet confluence is nothing without a valid setup.
No confirmation, no trade.


Nerdmond retweeted
Liquidation maps are one of the most useful free tools in crypto. Almost nobody reads them correctly.
A 🧵 on how to actually interpret them 👇
Nerdmond retweeted
THE BIGGER PICTURE. CONFLUENCES.
FIBONACCI V13
Fibonacci is not a strategy. It is a tool for measuring potential retracements, expansions, and time-based inflection points.
The real value isn't in the numbers themselves. It's in where they align with the story price is already telling.
A Fib level in the middle of nowhere means very little. A Fib level inside a strong demand zone, near a liquidity pool, or just above a significant high can add another layer of confluence to an already valid setup.
This is how I use it.
PRICE RETRACEMENTS
When price returns to a strong supply or demand zone, I look at how the Fib levels interact with that area.
Does the 0.5, 0.618, or 0.786 retracement overlap with the zone? Is liquidity resting nearby? Does market structure support a reaction?
The Fib doesn't make the zone strong. The zone earns its importance through structure, displacement, and context. The Fib simply adds another point of agreement.
EXPANSION & NEGATIVE FIBS
When a valid structure forms, I can use negative Fib extensions to project potential expansion targets.
My structural reference uses two consecutive candles in one direction, followed by two in the opposite direction, then two in the original direction. Inside bars don't count.
From there, I measure the swing low to swing high and watch extensions such as -0.5, -0.618, and -1.0.
These levels become potential target zones, not guaranteed destinations.
If a draw on liquidity sits just above a high or below a low, that liquidity takes priority over the Fib projection. The level helps frame the move, but the market's structure and available liquidity determine what matters most but the fib in the right place consolidates that thesis.
TIME IS ANOTHER DIMENSION
Most traders measure price. Fewer examine time.
Fibonacci time counts, such as 21, 34, 55, or longer sequences, can help identify windows worth watching for a potential shift in market behavior.
A time count alone does not predict a reversal. But when a time window aligns with a significant supply or demand zone, a liquidity event, and a meaningful structural level, it gives you another reason to pay attention.
The objective isn't to predict the exact candle. It's to recognize when several independent factors converge.
THE PRINCIPLE
A strong demand zone tells you where buyers may respond.
A liquidity pool tells you where price may be drawn.
A Fib level adds another reference point.
Time can help frame when a reaction may become relevant.
Structure and confirmation tell you whether the opportunity is actually developing.
Each piece has a purpose. None is sufficient on its own.
Stop treating Fibonacci as a collection of magical numbers. Treat it as another instrument for measuring the market, refining your zones, and building a more complete picture.
Confluence is not about collecting as many lines as possible. It is about finding meaningful agreement between factors that matter.
Yet confluence is nothing without a valid setup.
No confirmation, no trade.
THE BIGGER PICTURE. CONFLUENCES. SMT'S. V12
You know demand&supply, liquidity, ranges, market structure, in isolation they are all useless.
Study everything, learn everything, create a system with all the information you have, back-test and refine your edge.
Piece by piece improve that one system that you believe in.
Every strategy can work as long as it has an edge, the difference between the numbers stays within yourself, the discipline and the ability to apply everything you know to the charts.
SMT's THE STORY BEHIND THE DIVERGENCE
SMT stands for Smart Money Technique. It compares correlated markets to identify when their price action stops confirming each other.
But the real value goes beyond one asset taking a high or low while another refuses to follow.
It is about relative strength, relative weakness, and what they reveal about the market's condition.
Imagine BTC sweeps a significant low while ETH holds above its corresponding low.
If BTC then reclaims the level and shifts structure bullishly, the divergence becomes part of a stronger reversal thesis.
SMT didn't cause the reversal. It exposed a lack of confirmation before price action provided further evidence.
Capital doesn't always flow equally across assets. Investors may reduce exposure to one asset while increasing it in another, favoring the market showing greater relative strength.
However, SMT alone cannot prove that capital is rotating. It reveals differences in price behavior, not the actual movement of money. Other evidence is needed to confirm capital flows.
The real strenght of an SMT'. It adds confluence
Context is everything.
An SMT at a major HTF extreme, following a liquidity sweep and supported by a structural shift, carries more weight than a random divergence in the middle of a range.
And SMT isn't exclusively a reversal signal. It can also reveal relative weakness during continuation.
Don't trade the divergence alone.
Compare corresponding swings, understand the relationship between the assets, identify where the divergence forms, and observe what price does afterward.
SMT is not a prediction. It is a clue.
One market can reveal what the other is failing to confirm. Your job is to understand why that difference matters.


Nerdmond retweeted

Just walked into a @Nike store
Me: Hey looking for some new basketball shoes I used to wear Kobe’s what’s similar?
Nike: Oh we don’t have basketball shoes in the store you have to buy them online.
Me: I want to try them on to know they fit that won’t work.
Nike: Order online try it on and if it doesn’t fit return it in store.
Me: Ok that’s not ideal but whatever what shoe do you recommend that’s close to the Kobe’s.
Nike: We have the Caitlin Clarks.
Me: Oh I’m a male I’ll need a men’s shoe.
Nike: Oh yeah it is a man’s shoe we just name our new shoes after WNBA players.
Walks out of store….stock price makes a lot of sense now $NKE


Nerdmond retweeted

We are seeing a big whale step in and start aggressively accumulate ethereum:0x67466be17df832165f8c80a5a120ccc652bd7e69
This is small signal of what is to come in the near future.
People will eventually rotate back to strong community’s with time tested narratives.
The easiest play on the market right now is the Boys club.
ethereum:0x6982508145454ce325ddbe47a25d4ec3d2311933 will lead and his boys will follow.
Welcome the new whale, we will push hard with and for you 🍻
@Wolf0x67 +23.9% on the day, you still have time to accumulate before the big moves come.
