

Thematic investor | Market intelligence Ichimoku swing trader Equities & Crypto since 2017 Market structure, secular trends & trade journal
Joined June 2026
- Tweets2K
- Following20
- Followers602
- Likes899


Pinned Tweet
Our Sector Timeline Tracker (STT) is updated for Q4.
This edition looks deeper into each ecosystem’s key components, mapping their timelines, supply-demand conditions and estimated market opportunities, based on cited analyst research.
A clearer guide to where opportunity is developing, when it could scale and how large it could become.
The STT is updated quarterly with the latest available information.


Nittobo 日東紡 $3110.JP 2026 Q2 Earnings Results
Nitto Boseki reported its FY2026 second-quarter earnings results on November 5, 2026.
Financial Highlights (H1 & 26Q2):
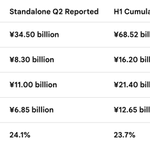
• Net Sales: ¥68.52 billion (approx. $433.9M), up 19.4% year-on-year from ¥57.41 billion.
Q2 standalone sales came in strong at ¥34.5 billion.
• Operating Profit: ¥16.2 billion (approx. $102.6M), jumping 71.5% year-on-year.
Q2 standalone operating profit was ¥8.3 billion.
• Operating Margin (ROS): Improved significantly by 7.2 percentage points to 23.7%, fueled by a shift toward high-margin specialty glass.
• Net Profit: ¥12.65 billion, up 84.0% year-on-year.
Segment Performance & Growth Drivers:
The growth was heavily driven by the Electronic Materials segment, which generated an operating profit of ¥14.7 billion (up ¥5.7 billion) across the first half. Demand remains critically tight for Specialty Glass (specifically low thermal expansion and low dielectric glass cloth) used in AI servers, semiconductor package substrates, and data center network equipment.
Updated FY2026 Full-Year Guidance:
On the back of the H1 numbers, Nittobo raised its full-year targets:
• Net Sales Forecast: Raised to ¥143.0 billion.
• Operating Profit Forecast: Raised to ¥34.0 billion.
• Capital Expenditure: Planning a record ¥45.0 billion to expand glass cloth production capacity in Fukushima, Japan, and build an additional melting furnace in Taiwan.
• Dividends: Raised the forecast annual dividend by ¥9 to ¥37 per share.
The earnings deck is big so will do a separate analysis.


Nitto Boseki Co. 日東紡績株式会社 $3110.T
Nittobo 日東紡 Deep Dive
Nittobo is becoming a much stronger bottleneck and quality story.
Nittobo's glass portfolio can be connected to both memory and logic. The material can be distinguished by application:
- T-glass: CPU/GPU/ASIC package substrates, plus thin/ultra-thin T for NAND & DDR memory.
- NE/NER: low-Dk glass for AI & data-centre server boards, switches, LPU/DPU/NICs and other high speed infrastructure.
- Nittobo expects both thick and thin T-glass demand to expand substantially in FY 2026 and explicitly says it is aggressively expanding capacity.
- Electronic materials revenue guidance rises from
¥61.4B → ¥77.8B, while operating profit rises
¥19.4B → ¥28.08B which is roughly +27% revenue and +44% operating profit.
The really interesting point is that isn't simply an AI GPU story, but memory is pulling T-glass demand as-well which considerably broadens the addressable bottleneck for Nittobo.
In conjunction just as with other passive components such as MLCC or CCL, the product mix is moving towards higher quality and higher value products, particularly NER.
So Nittobo is potentially getting volume growth + pricing + product mix improvement simultaneously.
Remember, specialty glass and it's place in upstream hierarchy. Upstream constraints have an adverse effect on downstream components because the material is becoming a prerequisite for the downstream capacity to function, so:
T-glass/specialty glass → CCL → PCB → ABF → substrate → package
The upstream glass portion may prove to be more strategically important than its dollar TAM suggests with obvious knock on implications for pricing power and allocations.
Nittobo is positioning themselves as an important upstream supplier in the supply chain.
This is one of our top picks in the passive component ecosystem that I'm not already in position on. Waiting for a decisive break of our downtrending supply line (blue dotted) OR a retest of our weekly Kumo edge support at $1913. This should be confluent with weekly oversold conditions which if given would be a great opportunity and an excellent R:R
#PCB #CCL #MLCC #SupplyChain #QGlass #TGlass


Nan Ya Plastics 南亞 1303.TW 2026 Q3 earnings Results
Financial Highlights: (Q3 2026 Unauddited)
• Consolidated Revenue: NT$95.60 billion (up from NT$83.65 billion in Q2 2026)
• Operating Profit: NT$11.36 billion (up from NT$2.37 billion in Q2 2026)
• Net Profit (Attributable to Shareholders): NT$38.83 billion (up 45.2% QoQ)
• Earnings Per Share (EPS): NT$4.90 for Q3 2026
• 1Q–3Q Cumulative EPS: NT$10.07 on cumulative revenue of NT$247.84 billion
Key Drivers:
• Electronic Materials & AI Demand: Surging capital expenditures in AI infrastructure created tight supply and higher prices for specialized electronic materials.
• Investment Income: Affiliate Nanya Technology contributed substantial equity-method investment returns (approx. NT$23.56 billion) to the quarter's bottom line.
I will try to get an earnings and market intelligence report ready for this one ASAP.


Nan Ya Plastics 南亞 1303.TW
As a follow-up to the "mini article" that I wrote at the bottom of this post.
I have not yet performed detailed financial analysis on the company but I did uncover some REALLY interesting information on the corporate structuring of the Nan Ya trio of companies.
→ I want to quickly point out that I see barely any mentions if any at all about this company which for me is bullish.
Nan Ya Plastics is becoming a lot more interesting 🚨
Nan Ya Plastics 南亞 1303.TW currently owns:
- ≈ 67% of Nan Ya PCB 南亞 8046.TW
- ≈ 30% of Nanya technology 南亞科 2408.TW
- 100% of PFG Fiber Glass, which makes electronic grade glass yarn
- 100% owned electronic materials subsidiaries producing combinations of CCL, copper foil, fiberglass fabric and epoxy
So 1303 owns/controls:
- epoxy/resins
- glass yarn/fabric
- copper foil
- prepreg/CCL
67% of Nan Ya PCB
- ABF substrates
- PCB
- BT
30% of Nanya Technology
- DRAM
Materials + substrates/PCB + memory all inside one economic group with vertical integration- that's powerful.
Vertical Integration here is VERY important:
Glass shortages
→ they make glass
Copper Foil shortages
→ they make CF
Resin/formulation scarcity
→ they formulate resin
CCL price inflation
→ they sell CCL
ABF/BT substrate shortage
→ 67% owned nan Ya PCB sells substrates
Memory recovery
→ 30% owned Nanya Tech. participates
That's a remarkable amount of the value chain under one corporate umbrella. They have constant access to most of the scarce upstream materials and the drastic price increases pass right through directly to their margin.
Nan Ya's electronic material segment reached roughly 58% of revenue in Q3 and OPM reached 30.9%. It is already mass producing M7/M8, has M9/M10 under qualification, and is developing its own HC resin as well as HVLP 4/5/6 copper foil 👀 👀 👀
1303 you have my attention !
The remaining question becomes- How does Nan Ya Plastics stand up to Outer Ninth's rigorous financial analysis ?
We intend to answer that question later this week.
Winway technology 穎崴 6515.TW 2026 Q3 Earnings
WinWay reported record-breaking third-quarter 2026 financial results driven by strong demand for AI and high-performance computing (HPC) test sockets.
Q3 2026 Financial Highlights
• Consolidated Revenue: NT$4.556 billion (approx. $139.0 million), up 29.32% QoQ and 152.55% YoY, marking six consecutive quarters of record revenue.
• Gross Margin: 41%, up 3 percentage points QoQ but down 1 percentage point YoY due to early-stage capacity expansion costs (depreciation and labor).
• Operating Profit: NT$1.239 billion, up 50.18% QoQ, with the operating margin improving from 24% to 28%.
• Net Profit After Tax: NT$1.034 billion (approx. $31.5 million), up 53.87% QoQ and 177.96% YoY.
• Earnings Per Share (EPS): NT$28.55 for the quarter.
Cumulative 9M 2026 EPS: Reached NT$66.85, surpassing the NT$10 billion revenue milestone for the first nine months of the year.
▶️ If you recall from our testing research the key observable for the remainder of 2026 was margin recovery as Q2 had a decline in GM & OPM.
Our research was released on 10.10.26 and you can also view this trend in image 2 which comes from Winway's investor conference, which was released 10.19.26 (both released pre-Q3 earnings).
Q3's GM & OPM both rose from the previous quarter:
• GM ≈ 38% → 41%
• OPM ≈ 24% → 28%
However, as can be seen in the 3rd image GM is still down YoY by a small amount.
This is the margin recovery we wanted to see and it will be important to continue to monitor to see if the margin recovery trend continues with their Q4 release along with achieving a positive YoY trend.


Testing & Advanced Packaging Research Results
As AI chips become more powerful, the work needed to test, connect and package them becomes more
demanding, which is creating opportunities for suppliers whose technology helps turn complex designs into
reliable products.
Our research follows that opportunity from the production line to the income statement, asking who is already earning from it, whose profits can grow over the next year, and how much of that growth the share price already reflects.
We aimed to search for scarce, qualified suppliers that can capture rising spending in testing and advanced packaging, asking whether those advantages reach earnings and cash within the next 12 months and whether investors are already paying for them.
This strengthens the distinction between a strong business and an attractive investment at a particular price.
Caveat:
This research prioritizes potential performance over the coming 1Y period and assumes entry at current valuations, using existing financial reportings, revenue, spending and margin trends. Entry prices from much lower or at different valuation multiples, change the rankings materially.
We are looking at investment potential from here, moving forwards. NOT if you entered near the summer lows or if your investment horizon extends far beyond the next 12 month period.
Many of the companies analyzed are amazing businesses and opportunities but they fall down the list because much is already priced in to their present share price and valuation. A lower entry from existing prices could offer a more attractive opportunity.
→ 24 companies were mapped and painstakingly analyzed within the testing and advanced packaging universe.
The Top 4 picks from here are:
Chunghwa Precision test (CHPT) 6510.TW
TSMC 2330.TW | $TSM
Hon. Precision 7769.TW
ASE Technology 3711.TW | $ASX
Chunghwa Precision Test stands out for its combination of expanding demand, improving profitability and room for earnings to disappoint before its investment case
falls short.
TSMC offers the strongest broad exposure, although its price leaves less room for error.
Hon. Precision is well placed in high-power testing, with cash collection the key condition to watch through the end of the year.
ASE is our leading packaging-and-test selection, but its narrow price cushion makes it the most sensitive of the four against stress testing.
Advantest and Chroma remain attractive businesses whose shares require more demanding earnings
outcomes, while WinWay needs stronger margin delivery.
Together, the findings point to a growing testing
opportunity, with the clearest investment cases where commercial progress, financial results and the price
paid support one another.
I'm attaching some charts, graphs and tables from my research (with more in the comments).
Preferred & Price qualified group top selections:
CHPT > TSMC > Hon Precision > ASE
The specialist growth group which separates strong growth from margin, delivery and price:
CHPT > Hon Precision > Chroma ATE > Winway
Broad quality platforms:
TSMC > Advantest > Keysight > Teradyne
Probe exposure group:
MPI > FormFactor > Tokyo Seimitsu > Micronics Japan
Recovery/Utilization group- Capacity must become earnings and cash:
ASE Technology > Powertech technology > King Yuan Electronics (KYEC) > Ardentec > Amkor
→ I've also attached a page in the comments that outlines recommendations by testing stage which I won't type out in the hope of keeping this as short and concise as possible (it's already very long 😅).
Top 15 Overall Rankings, Investment Grades and stock symbols:
The order is: Rank → Company → symbol
Then Grade (A/B) → Condition that is required to resolve (preventing it from a higher grade), where
grade A additionally clears the price/stress test.
1. Chunghwa Precision Test (CHPT) 精測 6510.TW
A- robust in tested cases
2. TSMC 台積電 2330.TW | $TSM
A- conditional on price
3. Hon Precision 鴻勁 7769.TW
A- conditional on price
4. ASE Technology 日月光投控 3711.TW | $ASX
A- marginal
5. Chroma ATE 致茂 2360.TW
B- price
6. Winway technology 穎崴 6515.TW
B- operating (margin)
7. Advantest アドバンテスト 6857.JP
B- price
8. MPI Corporation 旺矽 6223.TW
B- price
9. Powertech Technology 力成 6239.TW
B- price
10. Tokyo Seimitsu 東京精密 // アクテック 7729.JP
B- price
11. Keysight technology $KEYS
B- evidence
12. King Yuan Electronics (KYEC) 京元電 2449.TW
B- operating
13. FormFactor $FORM
B- evidence
14. Micronics Japan 日本マイクロニクス 6871.JP
B- operating
15. Ardentec 欣銓
B- evidence
Where:
- Conditional on price = higher share price without improved financial/operating metrics pushes the A → B
- Marginal = metrics currently just clear B grade
- Price = the business passes the operating test, but the price is too high. Resolves if the share price falls or the EPS rises.
- Operating = reported results fall short on execution or funding, resolving only through reported results, such as margin recovery, stronger cash collection or lower debt.
- Evidence = more evidence required, this is a data gap, not a negative reading.
Thematic Investment Group or Band Recommendations:
→ Growth:
CHPT > Winway > MPI > AEHR
→ Value:
TSMC > ASE > PowerTech > Tokyo Seimitsu
→ Present Optics exposure (revenue now):
Chroma ATE > Keysight > Viavi
→ Future Optics relevance/exposure (revenue opportunity later):
TSMC > ASE > MPI > FormFactor > Xintec
→ Memory relevance/exposure:
Advantest > PowerTech > Teradyne > Formfactor
As usual I will follow up with additional information and charts in the coming days. I hope this helps guide some of you in your research and investment decisions.


Tokyo Seimitsu 東精密 / Accretech アクレーテク 7729.JP 2027 Q2/H1 Earnings Release
Tokyo Seimitsu Co., Ltd. reported its first-half (H1 FY2027/3) financial results on November 4, 2026, showing strong growth driven by high-performance computing (HPC) and semiconductor production equipment (SPE) demand, according to the Tokyo Seimitsu Co Ltd Reports Advance In H1 Profit report.
H1 FY2027/3 Financial Highlights:
Revenue: ¥92.399 billion (+19.9% year-over-year compared to ¥77.070 billion in H1 last year)
Net Profit: ¥15.489 billion (up from ¥9.612 billion last year)
Earnings Per Share (EPS): ¥379.36 (up from ¥235.55 last year)
Full-Year Guidance (FY2027/3)
Full-Year Revenue Guidance: ¥192.000 billion
Full-Year Basic EPS Guidance: ¥788.3
Tokyo Seimitsu came in at #10 in our testing and advanced packaging research and is now also below our conditional price ceiling after the correction, making it a more attractive consideration at current prices.
Earnings presentation:
accretech.com/en/ir/library/…


Testing & Advanced Packaging Research Results
As AI chips become more powerful, the work needed to test, connect and package them becomes more
demanding, which is creating opportunities for suppliers whose technology helps turn complex designs into
reliable products.
Our research follows that opportunity from the production line to the income statement, asking who is already earning from it, whose profits can grow over the next year, and how much of that growth the share price already reflects.
We aimed to search for scarce, qualified suppliers that can capture rising spending in testing and advanced packaging, asking whether those advantages reach earnings and cash within the next 12 months and whether investors are already paying for them.
This strengthens the distinction between a strong business and an attractive investment at a particular price.
Caveat:
This research prioritizes potential performance over the coming 1Y period and assumes entry at current valuations, using existing financial reportings, revenue, spending and margin trends. Entry prices from much lower or at different valuation multiples, change the rankings materially.
We are looking at investment potential from here, moving forwards. NOT if you entered near the summer lows or if your investment horizon extends far beyond the next 12 month period.
Many of the companies analyzed are amazing businesses and opportunities but they fall down the list because much is already priced in to their present share price and valuation. A lower entry from existing prices could offer a more attractive opportunity.
→ 24 companies were mapped and painstakingly analyzed within the testing and advanced packaging universe.
The Top 4 picks from here are:
Chunghwa Precision test (CHPT) 6510.TW
TSMC 2330.TW | $TSM
Hon. Precision 7769.TW
ASE Technology 3711.TW | $ASX
Chunghwa Precision Test stands out for its combination of expanding demand, improving profitability and room for earnings to disappoint before its investment case
falls short.
TSMC offers the strongest broad exposure, although its price leaves less room for error.
Hon. Precision is well placed in high-power testing, with cash collection the key condition to watch through the end of the year.
ASE is our leading packaging-and-test selection, but its narrow price cushion makes it the most sensitive of the four against stress testing.
Advantest and Chroma remain attractive businesses whose shares require more demanding earnings
outcomes, while WinWay needs stronger margin delivery.
Together, the findings point to a growing testing
opportunity, with the clearest investment cases where commercial progress, financial results and the price
paid support one another.
I'm attaching some charts, graphs and tables from my research (with more in the comments).
Preferred & Price qualified group top selections:
CHPT > TSMC > Hon Precision > ASE
The specialist growth group which separates strong growth from margin, delivery and price:
CHPT > Hon Precision > Chroma ATE > Winway
Broad quality platforms:
TSMC > Advantest > Keysight > Teradyne
Probe exposure group:
MPI > FormFactor > Tokyo Seimitsu > Micronics Japan
Recovery/Utilization group- Capacity must become earnings and cash:
ASE Technology > Powertech technology > King Yuan Electronics (KYEC) > Ardentec > Amkor
→ I've also attached a page in the comments that outlines recommendations by testing stage which I won't type out in the hope of keeping this as short and concise as possible (it's already very long 😅).
Top 15 Overall Rankings, Investment Grades and stock symbols:
The order is: Rank → Company → symbol
Then Grade (A/B) → Condition that is required to resolve (preventing it from a higher grade), where
grade A additionally clears the price/stress test.
1. Chunghwa Precision Test (CHPT) 精測 6510.TW
A- robust in tested cases
2. TSMC 台積電 2330.TW | $TSM
A- conditional on price
3. Hon Precision 鴻勁 7769.TW
A- conditional on price
4. ASE Technology 日月光投控 3711.TW | $ASX
A- marginal
5. Chroma ATE 致茂 2360.TW
B- price
6. Winway technology 穎崴 6515.TW
B- operating (margin)
7. Advantest アドバンテスト 6857.JP
B- price
8. MPI Corporation 旺矽 6223.TW
B- price
9. Powertech Technology 力成 6239.TW
B- price
10. Tokyo Seimitsu 東京精密 // アクテック 7729.JP
B- price
11. Keysight technology $KEYS
B- evidence
12. King Yuan Electronics (KYEC) 京元電 2449.TW
B- operating
13. FormFactor $FORM
B- evidence
14. Micronics Japan 日本マイクロニクス 6871.JP
B- operating
15. Ardentec 欣銓
B- evidence
Where:
- Conditional on price = higher share price without improved financial/operating metrics pushes the A → B
- Marginal = metrics currently just clear B grade
- Price = the business passes the operating test, but the price is too high. Resolves if the share price falls or the EPS rises.
- Operating = reported results fall short on execution or funding, resolving only through reported results, such as margin recovery, stronger cash collection or lower debt.
- Evidence = more evidence required, this is a data gap, not a negative reading.
Thematic Investment Group or Band Recommendations:
→ Growth:
CHPT > Winway > MPI > AEHR
→ Value:
TSMC > ASE > PowerTech > Tokyo Seimitsu
→ Present Optics exposure (revenue now):
Chroma ATE > Keysight > Viavi
→ Future Optics relevance/exposure (revenue opportunity later):
TSMC > ASE > MPI > FormFactor > Xintec
→ Memory relevance/exposure:
Advantest > PowerTech > Teradyne > Formfactor
As usual I will follow up with additional information and charts in the coming days. I hope this helps guide some of you in your research and investment decisions.
King Yuan Electronics 京元電子 2449.TW has lowered it's Q4 guidance.
"Looking ahead to the fourth quarter, the company has lowered its guidance for quarter-on-quarter growth to a high single digit (approximately 7% to 10%). This is primarily due to slight delays in the mass production schedules of some key customers' next-generation GPU chips caused by yield issues in the HBM4 memory supply chain, coupled with a relatively weak recovery in demand from smartphones and consumer electronics. Furthermore, with the gradual installation of new production line equipment, depreciation expenses and labor costs are rising, and the gross margin is expected to decline slightly to 36% to 37% in the fourth quarter."
KYEC landed outside the top 10, at #12 in our testing and advanced packaging research. The $NVDA relationship makes this name more interesting but it does not guarantee performance as can be seen with the recent PA of $LITE $COHR $NBIS and others that Nvidia has partnered with.
KYEC will likely succeed as Nvidia tends to only partner with winners, however Outer Ninth Research indicated there are presently better testing opportunities out there.
Slower growth and decreasing margins are not a recipe for stock price performance, the outlook in H2 2027 seems potentially brighter for KYEC:
"Morgan Stanley points out that the delayed test orders will become apparent in the first quarter of 2027, at which time quarterly revenue is expected to grow by more than 10% to 15%, and gross margin will also rebound strongly to over 40%."
Source:
finance.technews.tw/2026/11/…


Taiwan’s KYEC lowered its Q4 guidance due to delays affecting a major GPU, believed to be NVIDIA’s Rubin, caused by HBM4 yield issues at a memory supplier.
finance.technews.tw/2026/11/…

Outer Ninth & @SemiAnalysis_ agree on
Advantest アドバンテスト 6857.JP | $ATEYY
"Advantest and Teradyne both reported 3Q26 this week. We believe the two calls say the same thing: the ATE TAM is growing on AI compute, and supply, not demand, is the constraint through 2027.
Advantest leads compute. SoC tester share rose from 56% to 66%, FY26 SoC guidance went up 10.6% to ¥1,375B on shipments ahead of plan, and the 10,000-system capacity target is being pulled forward.
We believe the 2027 upside comes from its own capacity expansion. "
Outer Ninth Research indicated that Advantest was the highest quality broad testing platform, but valuation at the time of research was preventing it from scoring higher. The valuation threshold ceiling was ¥30,600 which we are now below.
In Outer Ninth's opinion the recent correction is offering investors a chance to enter below the conditional valuation threshold at a more attraction PE.
I'm not suggesting the current correction is over and each investor must make their own individual determination on when to take on risk, but this is one for the watchlist and for consideration.
The green line on the chart is the conditional price ceiling to where it's attractive below, but less so above.


Advantest アドバンテスト 6857.JP | $ATEYY
2026 Q2 Financial Results 10.28.2026
Advantest reported their third quarter results, ending September 30th, 2026
Q2 FY26 Financial Highlights:
• Net Sales: ¥477.7 billion (up 30.0% quarter-over-quarter and 81.7% year-over-year)
• Operating Income: ¥266.8 billion (up 40.4% sequentially and 146.0% year-over-year)
• Operating Margin: 55.9% (expanding by 4.2 percentage points sequentially)
• Gross Margin: 71.1% (a new company record)
• Net Income: ¥193.3 billion (up 142.7% year-over-year)
First Half (H1 FY26) Performance:
• Net Sales: ¥845.2 billion (up 60.5% year-over-year)
• Operating Income: ¥456.8 billion (up 96.5% year-over-year)
• Net Income: ¥368.08 billion
Segment & Regional Breakdown:
• SoC Test Systems: ¥353.3 billion (main growth engine driven by GPUs, custom ASICs, and AI CPUs)
• Memory Test Systems: ¥53.4 billion
• Americas Region: ¥261.3 billion (accounting for over half of total revenue due to North American hyperscaler and fabless demand)
Raised Full-Year (FY26) Guidance:
• Due to the stronger-than-expected AI demand, Advantest upgraded its full-year outlook for the fiscal year ending March 2027:
• Full-Year Sales: ¥1,863.0 billion (up from ¥1,714.0 billion)
• Operating Income: ¥967.0 billion (up from ¥846.0 billion)
• Net Income: ¥741.5 billion (up from ¥660.0 billion)
• Basic EPS Forecast: ¥1,027.08
• Interim Dividend: Raised to ¥49 per share
I will likely not do a Market Intelligence Report for this one (mentioned priority basis) so I included some additional slides from their investor presentation and will include the link in the comments for those interested.


APPLIED OPTOELECTRONICS $AAOI Q3’26 EARNINGS
🔹 Revenue: $269.9M (Est. $268M) 🟢; +128% YoY
🔹 Adj. EPS: $0.17 (Est. $0.14) 🟢
🔹 GAAP EPS: $0.07
🔹 Non-GAAP Gross Margin: 28.7%
Q4 Guide:
🔹 Revenue: $385M-$420M (Est. $427M)
🔹 Adj. EPS: $0.48-$0.63 (Est. $0.56)
🔹 Non-GAAP Gross Margin: 29.5%-31%
Segment Net Revenue:
🔹 CATV: $110.9M; +57% YoY
🔹 Datacenter: $155.6M; +254% YoY
🔹 Telecom: $2.7M; -27% YoY
🔹 Other: $0.7M
Key Updates:
🔹 Record revenue: sixth consecutive quarter
🔹 Manufacturing capacity: approaching 330,000 units/month; over 500,000 800G and 1.6 Tb pieces/month by end-2026; over 1 million by end-2027
Comments:
🔸 “We have recently secured a multi-year strategic agreement with a Tier 1 hyperscale datacenter customer, which we think provides us with improved long-term visibility and reinforces our confidence in the opportunity ahead as demand for high-bandwidth, energy-efficient optical connectivity products continues to grow.” — Dr. Thompson Lin, AOI's Founder, President and Chief Executive Officer
🔸 “We expect our 2027 capacity expansion plan in the US to take longer to complete due to longer than expected time to obtain necessary electrical power among other construction related issues.” — Dr. Stefan Murry, AOI's Chief Financial Officer and Chief Strategy Officer

APPLIED OPTOELECTRONICS $AAOI Q3’26 EARNINGS HIGHLIGHTS
🔹 Revenue: $269.9M (Est. $268M) 🟢; +128% YoY
🔹 Adj. EPS: $0.17 (Est. $0.14) 🟢
🔹 GAAP EPS: $0.07
🔹 Non-GAAP Gross Margin: 28.7%
Q4 Guide:
🔹 Revenue: $385M-$420M (Est. $427M) 🔴
🔹 Adj. EPS: $0.48-$0.63 (Est. $0.56) 🟡
🔹 Non-GAAP Gross Margin: 29.5%-31%
Segment Net Revenue:
🔹 CATV: $110.9M; +57% YoY
🔹 Datacenter: $155.6M; +254% YoY
🔹 Telecom: $2.7M; -27% YoY
🔹 Other: $0.7M
Key Updates:
🔹 Record revenue: sixth consecutive quarter
🔹 Manufacturing capacity: approaching 330,000 units/month; over 500,000 800G and 1.6 Tb pieces/month by end-2026; over 1 million by end-2027
Comments:
🔸 “We have recently secured a multi-year strategic agreement with a Tier 1 hyperscale datacenter customer, which we think provides us with improved long-term visibility and reinforces our confidence in the opportunity ahead as demand for high-bandwidth, energy-efficient optical connectivity products continues to grow.” — Dr. Thompson Lin, AOI's Founder, President and Chief Executive Officer
🔸 “We expect our 2027 capacity expansion plan in the US to take longer to complete due to longer than expected time to obtain necessary electrical power among other construction related issues.” — Dr. Stefan Murry, AOI's Chief Financial Officer and Chief Strategy Officer

No matter how bad your portfolio looks today, you can at least find some solus that it can't be as bad as Leopold's 😅😢

JUST IN: Leopold Aschenbrenners Fund (Situational Awareness) has reportedly officially blown up…
These are the current (now liquidated) holdings:
- $MU bought at $1,153, now $703, (-39%)
- $CORZ bought at $25.6, now $11.1, (-56%)
- $SNDK bought at $2,268, now $874, (-61%)
- $NBIS bought at $273, now $121, (-55%)
- $CRWV bought at $99, now $42, (-57%)
- $BE bought at $301, now $165, (-45%)
Use him as a lesson why you NEVER over-leverage into high risk positions.
That concludes an end of an era…


Capitulation creating new lows ☠️
Stay safe out there guys, scary scenes but I wouldn't be shorting at this point.
I took some risk off across the board when we lost these lows on $QQQ which probably means we are close to the bottom 😂
Gotta go do some IRL stuff today.

Outer Ninth retweeted

BofA on the impact of blue wave on data center buildout:
"While tighter permitting, an expansion of state-by-state restrictions and higher costs could elongate project timelines, we view this as a supply/timing issue, not a demand issue. Compute needs still have to be met, with development potentially shifting toward more accommodating U.S. States or even internationally (e.g. Google’s recent $15bn expansion to Malaysia)."
$GOOGL $META $ORCL $MSFT $AMZN
Remember, data centres are global and fungible.
The democrats winning midterms will not stop the buildout, it may possibly slow NEW projects but there are plenty of alternative site options for the hyperscalers.

Outer Ninth retweeted

The AI trade is NOT dead.
$ATS.VI ER just dropped, they posted a record quarter.
> Q2 revenue €682M. +52% YoY, +24% QoQ
> EBITDA margin 35.8%. Was 23.3% a year ago
> Substrate segment H1 revenue +83% at a 43.8% margin
> EPS €3.05 vs €2.08 expected
AI substrate pricing is now showing up in the numbers.
Full year guide held. Revenue growth of 45 to 55%. EBITDA margin of 32 to 37%. H2 needs €683M to €773M a quarter.
Kulim is the next leg. Expansion and production start are on plan. More capacity in plant 1, a second building, and a new plant for substrate cores. €1.5 to 2B of investment, backed by long term customer commitments from $AMD, $MRVL and others.
Customers added €421M of prepayments in six months.
And the price? At €130.60, the whole company (shares plus debt) is valued at about €6.8B.
10.4x the last 12 months of EBITDA
7.3x this year’s guided EBITDA
7.0x Q2 EBITDA annualised
Asian substrate peers trade at 37 to 58x trailing EBITDA.
Talk about being undervalued.


$ATS.VI reports H1 later today, and the substrate peers have already shown their hands.
Ibiden: sales +34% YoY, electronics margin above 30%.
SEMCO: record quarter.
Nan Ya PCB: record October, +70% YoY.
FC-BGA substrate prices are up about 12% per square meter as of August.
AT&S last quarter: substrate revenue +93% at constant currency with a 42% EBITDA margin. Management said price was only about 10 points of the 45-55% growth guide, and further inflation is "certainly not included".
So if peers are printing records on price, a beat looks probable to me. My bar is Q2 revenue of €650M+ and a 40%+ substrate margin.
Caveat: SEMCO's record quarter still got sold 20%, so a beat isn't a guaranteed green day, but the odds are stacked in our favour imo.
nitter.gq/mkfilko/status/2115315…
GM 🌤️
Waking up to a 🩸🛀
The start of capitulation ?
Tough to stomach but time to pay attention.
peak fear will = max opportuity.


Lotte Energy materials 롯데에너지머티리얼즈 020150.KW
Is a name I've spoken about and given you guys a heads up on 👇
The HVLP Copper Foil Bottleneck:
nitter.gq/outerninth/status/2099…
nitter.gq/outerninth/status/2109…


This quoted post is unavailable.
ARM holdings $ARM 2027 Q2 Earnings Results
• Arm AGI CPU: Up to $2B revenue opportunity across FY27–28
• Physical AI: Launched Arm Total Design with 80+ companies
• Server Share: 15% in 2024 → 50%+ in 2025; 60%+ expected by end-2026
• Arm-based PCs: ~20% of global shipments
“demand for our silicon business continues to accelerate, with growing customer commitments giving us even greater confidence in achieving up to $2 billion in Arm AGI CPU revenue across fiscal 2027 and 2028.”


COHERENT $COHR Q1’27 EARNINGS
SUMMARY:
🔹 Revenue: $2.37B (Est. $2.31B) 🟢; +50% YoY
🔹 Adj. EPS: $2.09 (Est. $1.97) 🟢; +80% YoY
🔹 Non-GAAP Oper Income: $550M (Est. $527M) 🟢
🔹 Non-GAAP Gross Margin: 40.6% (Est. 40.4%) 🟢; +184 bps YoY
Q2 Guide:
🔹 Adj. EPS: $2.28-$2.48 (Est. $2.21) 🟢
🔹 Non-GAAP Gross Margin: 40%-42%
Segment Revenue:
🔹 Datacenter & Communications: $1.95B (Est. $1.86B) ; +79% YoY
🔹 Industrial: $418.6M (Est. $447.5M) ; -15% YoY
Key Updates:
🔹 FY27 Pro Forma Revenue Growth: exceeds 60%
Comments:
🔸 “We expect fiscal 2027 pro forma revenue growth to exceed 60%.”
🔸 “We expect to achieve our first quarter with non-GAAP gross margin above 45% before the end of calendar 2028.”
COHERENT $COHR Q1’27 EARNINGS HIGHLIGHTS
🔹 Revenue: $2.37B (Est. $2.31B) 🟢; +50% YoY
🔹 Adj. EPS: $2.09 (Est. $1.97) 🟢; +80% YoY
🔹 Non-GAAP Oper Income: $550M (Est. $527M) 🟢
🔹 Non-GAAP Gross Margin: 40.6% (Est. 40.4%) 🟢; +184 bps YoY
Q2 Guide:
🔹 Adj. EPS: $2.28-$2.48 (Est. $2.21) 🟢
🔹 Non-GAAP Gross Margin: 40%-42%
Segment Revenue:
🔹 Datacenter & Communications: $1.95B (Est. $1.86B) 🟢; +79% YoY
🔹 Industrial: $418.6M (Est. $447.5M) 🔴; -15% YoY
Key Updates:
🔹 FY27 Pro Forma Revenue Growth: exceeds 60%
Comments:
🔸 “We expect fiscal 2027 pro forma revenue growth to exceed 60%.”
🔸 “We expect to achieve our first quarter with non-GAAP gross margin above 45% before the end of calendar 2028.”

The aftermath of fire at the panasonic factory.🔥👀
The fire was at Panasonic’s PCB and semiconductor substrate materials operation in Hukou.
The factory produces advanced printed circuit board (PCB) materials. Its manufacturing processes and on-site storage may involve large quantities of epoxy resin, chemical adhesives, and highly volatile flammable organic solvents, such as acetone and toluene.
The Hsinchu plant accounts for roughly 10% of Panasonic's total production capacity for multilayer substrate materials, which are critical components for PCBs used in computers and AI servers.
Downstream Implications:
Because this plant represents roughly 10% of Panasonic's global capacity for these specialized substrate materials—and was running at full capacity due to the global AI hardware boom—downstream PCB fabricators in Taiwan and across Asia will face immediate raw material allocations and extended lead times. While Panasonic owns sibling plants in Japan, China, and Thailand, transferring precision chemical configurations and scaling up production to cover the loss of the Hsinchu plant will take time.
The facility operates as a Copper Clad Laminate (#CCL) and chemical formulation plant, the production lines and stored inventories for the following advanced product lines are directly affected:
1. High-Speed, Ultra-Low Loss Circuit Board Materials (The "MEGTRON" Series)
The Hsinchu R&D and manufacturing facility is a key production site for Panasonic's flagship MEGTRON series. These specific substrate materials are globally indispensable for high-frequency infrastructure:
Affected Products: MEGTRON 6, MEGTRON 7, MEGTRON 8, and MEGTRON 9 multi-layer glass epoxy laminates and prepregs.
These materials are the foundation for the specialized high-layer PCBs required in AI servers (such as $NVDA GPU platforms), high-speed routers, switches, and ICT data centres.
2. Semiconductor and IC Substrate Materials (The "LEXCM" Series)
As a designated Semiconductor Materials R&D and manufacturing hub, this facility handles advanced packaging resins and laminates:
Affected Products: LEXCM GX IC substrate materials, as well as LEXCM CF and LEXCM DF series semiconductor encapsulation and packaging materials.
These include board-level underfills, liquid chip adhesives, and wafer-level packaging resins. Disruption here bottlenecks the packaging of microchips, memory modules, and processing units used across consumer electronics and automotive systems.
3. Automotive & High-Frequency RF Materials (The "HIPER" & "XPEDION" Series)
The plant handles formulations built to survive extreme heat and maintain high-frequency signal integrity:
Affected Products: HIPER series multi-layer materials (engineered for automotive electronic control units or ECUs) and XPEDION series high-frequency RF communication materials.
End-Use Impact: Advanced Driver Assistance Systems (ADAS), automotive radar, and 5G base station wireless equipment.
4. Eco-Friendly & Flexible Materials ("Halogen-Free" & "FELIOS")
The plant processes green chemical formulations and flexible electronics materials:
Affected Products: FELIOS series flexible circuit board materials and Panasonic’s specialized Halogen-Free high-heat glass epoxy sheets.
End-Use Impact: Rigid-flex PCBs used inside smartphones, camera modules, and electric vehicle (EV) battery management systems.
Panasonic パナソニック 6752.JP

CCL 👀
In the early hours of today (November 4), a major fire broke out at Taiwan #Panasonic’s multilayer materials plant on Guangfu Road in the Hsinchu Industrial Park. The incident was accompanied by loud explosions and massive plumes of thick black smoke.
The facility manufactures advanced printed circuit board (PCB) materials. Its manufacturing processes and on-site storage may involve significant quantities of epoxy resins, chemical adhesives, and highly volatile, flammable organic solvents such as acetone and toluene.
Chemicals and plastic materials are reportedly burning, generating dense smoke that may contain toxic and irritating gases, potentially including dioxins and nitrogen oxides (NOx). The exact chemical composition and toxicity of the emissions have yet to be confirmed.
