







$Happy is slowing turning.
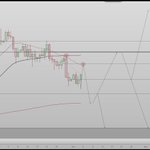
You see how the steep downtrend was already broken?
Well, now it has broken the intermediate downtrend too.
It is about to reclaim the support and confirm the fact that the downtrend is over.
This means it enters in an accumulation that could take 1 week or 1 month, but no matter how much it takes, the direction should be to ATH.
Do not sleep on this!


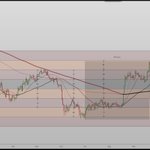
$BTC is pulling out an inverse head and shoulders, exactly what $PEPE did before going parabolic.
The right shoulder is even forming in the same duration and the only difference is that $BTC had the head formation at 1 to -0.25 instead of -0.25 to -0.5 which is why it went to top the right shoulder at 1 to 1.25 fib. instead of 0.75 to 1 fib., basically a difference of 0.25 in both head and right shoulder in terms of strenght.
Naturally we should expect the bottom of the right shoulder to be at 0.25 to 0.5 fib. instead of 0 to 0.25 fib and maybe even in the same duration which would put us at 17th of November for the completion of the right shoulder.


This is the first time where $BTC went higher in the second part of the midterm year while in the past that was the time for the final capitulation.
I am not disregarding another move higher, but it is got to be from here or 73k-74k max.
But..we will pay for this bullish second half of the year in the first half of the next year.

Will $BTC end this downtrend move with another 2 strong red weekly candles?

Binance hack might be just the first in a long row of hacks targeting other exchanges and I might just found the pattern to support this claim.
This pattern is an unique way of looking at $BTC main downtrend moves which we had 3 completed so far and currently, we are in the 4th.
Downtrend 1 and 3 are twin moves, both have the same number of red and green weekly candles, the only difference is that the sequence they occur in is inverted.
My Idea is that we are are in the second twin move with the first twin move finished in the second downtrend with 6 red weekly candles in a row. The move started with 3 strong red candles and ended with 3 weak red candles.
We are now halfway finished with the second twin move where we already had 3 red weekly candles in a row but yet again, the move is inverted and we have started with 3 weak red candles.
All this means that the worst is yet to come and all that is left is to end the second twin with 3 strong red candles, which I think they could be driven by a series of hacks and Binance is just the start.


Gonna be interesting

Key Events This Week:
1. October ISM Manufacturing PMI data - Monday
2. Apple, $AAPL, and Palantir, $PLTR, Report Earnings - Monday
3. US Midterm Elections - Tuesday
4. September JOLTS Job Openings data - Tuesday
5. AMD, $AMD, and SMCI, $SMCI, Report Earnings - Tuesday
6. October ADP Nonfarm Employment Change - Wednesday
7. October ISM Non-Manufacturing PMI data - Wednesday
8. October Jobs Report - Friday
9. November MI Inflation Expectations and Consumer Sentiment data - Friday
10. ~20% of S&P 500 Companies Report Earnings This Week
11. Total of 5 Fed Speaker Events This Week
Buckle up for a huge week ahead.
What you can expect, at the very least, after this monthly bearish engulfing is for $ETH to put one more monthly candle of similar strenght to the downside.
Once the price goes below the wick from the engulfing candle, the show begins.

$ETH is about to engulf the previous monthly candle.
If it does not close above $2,355.20 TODAY, the engulfing will succeed.
Because it has such a high chance of succeeding, I thought I should look on all the previous engulfings to see what happend after that.
Because there still is a small chance of a failed engulfing, I looked at those too.
From the top of 2018 up until now we had 12 successfuly engulfing candles and only 5 failed engulfings.
You can see how rare this is because basically in 8 years we had 17 situations like this.
Now, you can make up your own idea of what is the common outcome of an engulfing like this but if you include only the exact same cases like we have now it ain´t looking good.

With the bearish engulfing confirmed on $ETH now I see this pattern forming also, with confirmation on weekly close below the red candle area.
Bullish patterns and bearish pattern formed a few times into this high timeframe chop and that gives some information on how this one could play out.
Remember, with that bearish engulfing on the monthly, $ETH has a strong tailwind to the downside.
