

AI Data Visualization | Tableau Visionary | ex-AWS Business Anlayst
대한민국 서울
Joined May 2016
- Tweets117
- Following201
- Followers887
- Likes346




Brought 3D data visualization into Tableau.
City Pulse:
• 24h NYC taxi activity in 3D
• connected to real Tableau data
• filters + parameters work
• built as a .trex Extension
Web prototype → working Tableau version in a day with Codex.
Custom visualization is getting much cheaper to test inside real BI workflows.
What does a month of New York movement look like in 3D?
31 days. 24 hours. 263 taxi zones.
I built an interactive mobility atlas with Astra + Three.js using NYC taxi data — you can replay the city hour by hour, unfold 24h at once, and compare each day against its typical pattern.
Prompt below ↓
3
2
438
- 03 Unfold 24h: the top 20 zones leave the map and fly into a 20 × 24 grid (rows = zones, columns = hours); column height = pickups; the current hour glows as a moving band.
- 04 Ghost city: observed pickups vs. the selected reference average; translucent "ghost" volumes show the average, solid volumes the observed day; label the largest gaps.
Motion:
- Continuous replay blends smoothly between hourly observations (no stepping).
- Hour changes must not stall the render loop: precompute per-hour targets, interpolate heights on the GPU/in the loop, never rebuild geometry on the main thread per tick.
- Respect prefers-reduced-motion (no camera easing, no particle motion, instant view changes).
- Pause rendering when the stage is off-screen (IntersectionObserver).
## Location Insight (inspector)
- Zone select (all 263 zones + "All city zones"), borough, zone code, clear button.
- Recorded pickups (selected date/hour) vs. comparison average (with day count).
- Departure from average: signed value, %, and a range bar (day min–max, dot = selected date).
- Pickup rank (#01 / 263) and median trip.
- "The 24-hour signature": hourly sparkline of observed vs. average + range, peak hour label.
- "Where they went": top destination zones with trip counts (clickable to select).
- "Find the biggest shift": jump to the zone-hour with the largest gap across 263 × 24.
- Weekday / weekend effect: average pickups per day by hour, two lines (solid weekday, dashed weekend), one-line insight.
- Footnote: "Per-day averages, not totals. January holidays are included."
42
# Build "City Pulse": an interactive 3D mobility atlas of New York City taxi activity (January 2025)
## Goal
A single-page, English-language web visualization that shows how New York moves across one month:
31 days, 24 hours, 263 taxi zones. The reader should be able to watch the city's daily rhythm,
compare any day against a typical weekday or weekend, and inspect any zone in detail.
It is a descriptive analysis tool, not a real-time or GPS product. Every visual must state what one mark represents.
## Data
Sources (public):
- NYC TLC Trip Record Data, Yellow Taxi, January 2025 (parquet)
- NYC TLC Taxi Zones (263 zones, shapes + borough lookup)
- NYC Open Data building footprints (Manhattan only, as visual context)
Preprocessing (Python + DuckDB or pandas), output small static JSON files:
- Filter invalid trips: pickup outside Jan 2025, non-positive or > 3h duration, unknown zones (264/265).
- Per day, per zone, per hour: pickup count, median trip duration.
- Per day, per hour: top origin → destination zone pairs (aggregated flows, top N per hour).
- Reference averages per zone-hour: weekday average (23 days) and weekend average (8 days), per-day means, holidays kept in the weekday group.
- Month-level fixed scale: max zone-hour pickups, used for every day so heights stay comparable.
- Zone metadata: id, name, borough, centroid, label anchor. Simplify zone geometry.
Files: month.json (daily totals, scale, top zones), weekday.json, weekend.json, days/2025-01-DD.json, zones geojson.
Load the current day lazily; keep the first paint fast.
## Stack
- One self-contained HTML file (or small Vite app) with Three.js 0.160 (ES modules via importmap), OrbitControls, EffectComposer + bloom.
- D3 only for scales/formatting and small SVG charts.
- No framework required. No external API calls at runtime; everything reads the static JSON.
## Layout (desktop 1920×1080 must fit in one screen without scrolling)
1. Header: "CITY PULSE / MOBILITY ATLAS", "Recorded replay" status, "Data & methods" link.
2. Status row: "A city, in motion." + three KPIs: citywide pickups (selected hour), vs. comparison average, median trip time.
3. Month strip: 31 day buttons as mini bars (bar height = daily pickups, weekends marked), prev/next day, date select, "Compare with" select (Weekday average · 23 days / Weekend average · 8 days).
4. Story bar: "Every movement leaves a pattern." with 4 chapters (01 Watch, 02 Unfold, 03 Compare, 04 Share) and "Start the story".
5. View tabs: 01 Connections, 02 Volume city, 03 Unfold 24h, 04 Ghost city, plus "Share finding" and "Create briefing".
6. Workspace: 3D map stage (left) + Location Insight inspector (right, ~330px, scrolls internally).
7. Timeline: Play day, speed (0.25×–4×), hour scrubber over a 24-hour bar chart of the selected day vs. average.
Map stage height must adapt to the viewport (clamp between ~470px and ~780px) so the whole console, including the timeline, is visible at 100% zoom.
## 3D scene
- Dark ground, zone outlines as thin lines, Manhattan building footprints as faint real-world context.
- Camera: perspective, orbit + zoom, a recenter button. Keep the user's camera when switching views, except "Unfold 24h", which always reframes to show the whole matrix.
- Hover a zone: tooltip with name and pickups. Click a zone: select it (updates inspector and flows).
Views (each switch animates, no hard pops):
- 01 Connections: aggregated zone-to-zone trips as glowing arcs with moving light particles; particle density ∝ trips; label the featured flow ("FROM / Midtown Center → TO / Upper East Side North, 71 trips / 18:00"). Caption: "Recorded zone-to-zone trips · schematic motion. Not GPS."
- 02 Volume city: each zone extruded; height = pickups on the fixed monthly scale; selected zone highlighted.
61
Goal: Build “City Pulse,” an interactive 3D mobility atlas of New York City taxi activity (January 2025).
Data: NYC TLC Yellow Taxi records + Taxi Zones + NYC building footprints.
53
A few recent experiments in 3D data visualization with Astra.
Mostly exploring what becomes possible when depth and interaction are treated as data, not decoration.
2
291
3D data visualization with Astra.
1,280 fragments morph between a knot, a double helix, and a bloom, surrounded by 4,096 particles.
The side panels track their speed and spatial distribution in real time.
Drag to rotate. Adjust the motion. Scatter the pieces.
Seoyeon Jun 📊 retweeted

Introducing the 2026 #TableauVisionary leaders!
These 41 community leaders push the boundaries of mastery, teaching, and collaboration in the DataFam. They aren't just experts; they are the architects of the future of analytics.
Meet them here: tabsoft.co/4lDHHPC

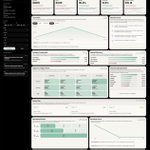
AI Data Analyst OS
I built an AI that turns raw CSV into a full analysis dashboard.
KPIs. Charts. Retention curves. Action plan. All from 1 prompt.


🌏 Built a 3D globe visualization of global refugee migration using Claude Code.
• Three.js
• GSAP
• Custom GLSL shaders
• UNHCR data (2020–2025)
117M+ people displaced worldwide.
Explore the interactive globe:
migrationtrack.netlify.app/
#ClaudeCode #dataviz #threejs
Inspired by the AntiGravity intro,
I built a space visualization using Claude Code 🌌
Chatbot + 3D + interaction + BGM — all on the web.
Feels like the line between data, design, and code is disappearing.
#ClaudeCode #CreativeTech #DataVisualization #3DWeb #AIxDesign