

What the filings say vs What the price assumes.
Wall Street
Joined April 2021
- Tweets687
- Following38
- Followers50
- Likes47




Pinned Tweet
Building wealth in the stock market is simpler than people think.
Identify critical bottlenecks across industries. Invest in the companies solving them and capture their growth over the medium term.
Then recycle those profits into long-term compounding machines: businesses consistently growing free cash flow and revenue per share, with strong returns on capital.
Use bottlenecks to build wealth. Use compounders to preserve and multiply it.
$COIN It's not a bank charter. No deposits, no loans. Here's what changes, and what doesn't.
2/ What it is: a federal charter for custody and trust services, replacing a patchwork of state-level oversight. The institutional custody business sits today in a New York-chartered trust company.
3/ What it isn't: a commercial bank. Coinbase has said it won't take retail deposits or do fractional reserve lending. Trust charters typically don't carry FDIC insurance either.
4/ US users: no new deposit protection, and no change to what you hold. The charter is about who supervises custody, not insuring it. What it may unlock is products: Coinbase has named stablecoin issuance, servicing, and payments as next.
5/ Non-US users: I haven't found anything in the announcements that addresses them. Anyone claiming a direct effect is guessing. Check your own entity's terms.
6/ The open risk: a banking-industry lawsuit against the OCC challenges how it reached its reading of the trust charter. A ruling against it would matter to every crypto trust charter, not just this one.

1/ Cisco's $CSCO Q4 GAAP EPS rose 52%. Operating income rose 38%.
The gap sits below the operating line: other income was $822M, vs $53M a year earlier.
It reports Thursday. Here's what I'll check.
2/ Q4 FY26 income statement:
Operating income $4,264M (vs $3,087M)
Pre-tax income $4,933M (vs $2,999M)
Pre-tax income rose $1.93B. Interest and other contributed $757M of that, about 39%. Operations did the rest.
3/ Full year: GAAP net income $13.3B, up 30%.
Operating cash flow $14.2B, which Cisco calls flat.
Net income grew by about $3.1B. Cash from operations didn't move.
4/ The fair read: Q4 revenue +18% to $17.3B, networking orders +40%, $9.3B of hyperscaler AI orders in FY26.
Operating income grew 38% on that. The business isn't the question. The quality of the EPS growth is.
5/ Thursday I'm checking:
- what is inside the $822M of other income (I haven't found it yet)
- whether Q1 operating cash flow tracks net income
- the tax rate: 21.8% in Q4 vs 15.0% a year ago
I'm wrong to flag this if Q1 other income is small and GAAP EPS growth stays within a few points of operating income growth.


1/ How does Huang’s affair affect $NVDA?
Facts first. On Nov 8 Huang told Nvidia staff he was unfaithful to his wife. The woman is Alice Huang, a Megaspeed executive with no relation to him, whom US officials believe to be a foreign intelligence asset.
The espionage allegation is unconfirmed. Nvidia CEO Jensen Huang admits affair, board to launch investigation.
2/ Nvidia’s board has opened an independent investigation into whether Huang was the target of a foreign intelligence effort. It says it has no reason to believe national security or company secrets were compromised. Sen. Coons has promised a congressional probe.
3/ The price so far: NVDA fell 9.26% to $181.60 on Nov 5, its biggest one-day drop since January 2025. The stated drivers were fears of costlier borrowing and delayed data center builds. The affair isn’t one of them: the FT’s report on the relationship came Nov 7 and the admission came Nov 8, a Sunday.
4/ The fundamentals haven’t moved: six straight quarters of EPS and revenue beats, and fiscal Q3 guidance of $108B that excludes China data center sales. The China-licensing headline risk is largely outside the guided numbers.
5/ My view: a small key-man and governance discount, not a thesis break. Monday’s open is the first real test.
Falsifiable: NVDA underperforms SMH by less than 3% over the next 5 sessions. I’m wrong if the probe finds compromised secrets, Huang steps aside, or Congress moves on chip licensing. Not financial advice.
JUST IN: 🇺🇸🇨🇳 Nvidia $NVDA CEO Jensen Huang sends letter to employees after being targeted by female Chinese spy:
"I was unfaithful to my wife. My actions hurt her and our children. There is no excuse for what I did."
"I am fully committed to NVIDIA and will work to earn back your confidence."


The Other Column retweeted
The other side of that $664B RPO, from Oracle’s 10-Q:
~13% is expected within 12 months
$288B of data-center leases haven’t started yet
~$88B net debt (my math), so EV is nearer $430B than $344B
RPO is signed revenue. This is the other column.


This chart is true and almost useless as a forecast. Here’s why.
1/ 56 events ≠ 56 observations.
-4% days cluster: 1987, 2000-02, 2008, 2020. And the 3-month windows overlap, so one crash episode gets counted over and over. The real sample is closer to 15-20 independent episodes (my estimate).
With crisis-regime volatility that high, a gap of 6.7% vs 2.2% is not far from noise.
2/ A mean isn’t a typical outcome.
+6.7% is pulled up by a handful of V-shaped rebounds. The average hides the paths that went the other way. After the Sept 29, 2008 drop (-8.8%), the S&P was roughly 20% lower three months later.
Show me the median, the hit rate, and the drawdown before the rebound. A +6.7% average that includes -15% along the way isn’t a “buying opportunity” for most people.
3/ “All periods” is the wrong baseline.
A -4% day only happens in a high-volatility regime, so compare against other high-vol periods, not the whole sample. Otherwise you’re measuring volatility mean-reversion and calling it “buy the dip.”
4/ This selloff isn’t like most of the sample.
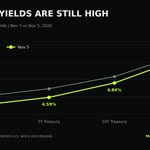
Most -4% days were liquidity panics. This one is a policy and capex shock to the AI trade: the Nasdaq is 11.9% below its all-time high, and the 10-year yield fell to 4.83% after topping 5.30% last month, with the Iran war unresolved.
Is AI capex cyclical or structural? An average of 56 days since 1952 can’t answer that.
5/ I’m not saying the market won’t bounce. It might. I’m saying this chart isn’t evidence for it.
Good version of this analysis: decluster the events, one per episode, report medians and hit rates, and use a vol-matched baseline. Until then it’s a mean of a fat-tailed, clustered sample.

History says last week's drop was a buying opportunity.
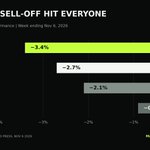
On Thursday, the S&P 500 declined -4.4%, its largest daily drop since April 2025.
Before that day, the index recorded 56 one-day declines of at least -4.0% since 1952.
Following such drops, the S&P 500 has gained +1.0% on average over the next week.
By comparison, its average weekly return across all periods has been +0.2%.
Over the next month, the index has averaged a gain of +2.0%, compared with +0.8% across all periods.
Over the following 3 months, the S&P 500 has averaged +6.7%, more than triple the historical average of +2.2%.
History suggests the market is set for a meaningful rebound.

🚨 TAKE-TWO $TTWO REPORTS MONDAY, 10 DAYS BEFORE GTA VI
No GTA VI sales are in this quarter yet. The number to watch is its $8.0-8.2B full-year bookings outlook, which counts on the Nov 19 launch.
Raise or hold?

$PLTR's latest filing tells a different story from the idea that its valuation rests primarily on political influence in Washington.
Q3 2026:
• Revenue: $2.31B (+96% YoY)
• U.S. government: $953M (+96%)
• U.S. commercial: $984M (+148%)
For the first time, U.S. commercial revenue exceeded U.S. government revenue.
But there's another number worth examining.
Total contract value closed grew just 6% YoY to $2.92B, despite revenue growing 96%.
Management says several large Sovereign AI contracts had unusually short durations. That's a plausible explanation, not yet proof of sustained demand. U.S. commercial remaining deal value also rose 79%, an important counterpoint.
The valuation may still be difficult to justify. But the filing doesn't establish that $GDYN, $EPAM or $KD are taking market share.
The question isn't who occupies the White House. It's whether future bookings and renewals can sustain the growth already reflected in expectations.


🚨 JUST IN: ANTHROPIC STRIKES $3.4B DEAL FOR GAS-FIRED POWER, PER FT
It took over 1.7 gigawatts of Caterpillar $CAT generator orders from supplier OnePWR. AI labs are now buying their own power gear to skip years-long waits.

Customer A was 36% of Q2 revenue, B 26%, C 10%.
Customers are unnamed, and the filing says A-D can be different customers across periods.
A and B each hold 32% of receivables. Backlog: 41% by Jun 2028, 39% in months 25-48, the rest after. The funding gap: H1 capex $14.1B vs $3.7B operating cash flow.Debt ~$35B.
Maturities: $4.4B rest of 2026, $6.2B in 2027. Cash $5.5B, plus $2.0B undrawn revolver.
Covenants: in compliance (Note 10). My read: refinancing is the question. Also: $35.5B of leases not yet commenced, starting 2026-2029 (Note 8).
Operating loss is small ($49M). Interest turns it into a $626M net loss.Not a bear case: revenue +112% to $2.6B. The question is who funds the build.
Position: I am personally skipping $CRWV . Not advice.
$CRWV reports Tue after close. Baseline from the June 10-Q:
Top 3 customers: 72% of revenue (my sum)
Backlog: $103.7B, 41% lands by mid-2028
H1 capex $14.1B vs $3.7B operating cash flow
Net interest $640M vs a $49M operating loss
I’ll check each against Tuesday’s filing.


Receivables: $63.1B at Jul 26 vs $38.5B at Jan 25 (+64%).MD&A cites extended payment terms on large multi-quarter deals with investment-grade customers. The filing says terms could reach up to one year.Normal for big contracts. Still a number to track.
One customer was 16% of Q2 revenue. Five customers hold 22%, 14%, 13%, 11% and 10% of receivables.The 10-Q also says AI clouds and model makers “lack the ability to secure long-term infrastructure contracts and investment-grade financing.”
Not a bear case. Revenue doubled to $96.2B and the filing shows real cash flow.What I’d watch: does supply commitment growth outrun revenue growth? I’ll revisit it with the next 10-Q.
Position: Long $NVDA. Not advice.
Forward P/E assumes the revenue keeps coming. What Nvidia’s 10-Q shows behind it:
5 customers = 70% of receivables (my sum)
Supply commitments: $119B to $279B in one quarter
Guarantees up to $105B for an OpenAI-affiliated customer
Same revenue. More exposure.

Everyone is quoting Alphabet’s ($GOOG) -$9.1B free cash flow. Wrong number.
The 10-Q’s commitments note says $1,054.9B: $924.4B of purchase commitments plus $130.5B of leases not yet started. None of it is on the balance sheet. A year ago the equivalent lines were about $136B.
$213.4B comes due within 12 months. Q3 operating cash flow was $42.3B, about $169B annualized. Operations won’t cover it. Alphabet raised $41.1B of debt and equity last quarter, long-term debt is $125.1B (up from $46.5B in December), and buybacks went to zero.
The -$9.1B is also flattered and distorted. It includes a $5.2B fine payment and TPU inventory built before delivery. Strip the fine and it’s about -$3.9B.
The bull case is real: Cloud +103%, backlog $513.9B at June 30. But capex used to be a dial. Take-or-pay contracts and non-cancelable leases make part of it a fixed cost. Fixed costs against uncertain demand is leverage in both directions.
Q3 GAAP EPS of $2.12 also carries an $8.7B equity loss, mostly SpaceX. That P/E measures a private valuation as much as Google.
I’m wrong if Q3 backlog exceeds these commitments and Cloud margin holds as the leases start.
Source: Alphabet 10-Q, Sept 30, 2026.
