

25+ yrs trading experience | Quantitative System Designer | Mechanical strategies designed for consistent risk-adjusted returns | https://nitter.gq/t.co/pVoNpToWV5
USA
Joined July 2007
- Tweets8K
- Following1.3K
- Followers1.7K
- Likes427
Pinned Tweet
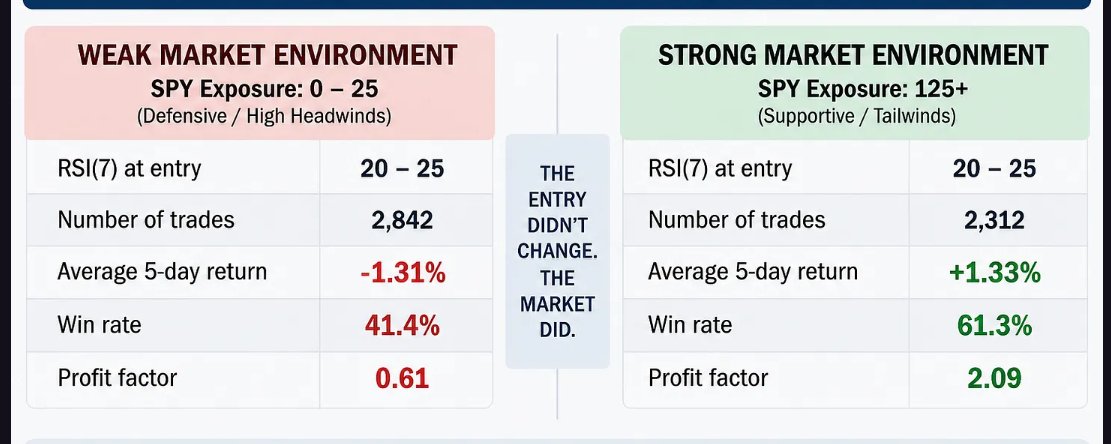
$SPY If you don't know the nightly exposure number, you are trading with one hand behind your back.
The amount of research expressed in that one number is far beyond most publicly available research. You can get it for free 💪 $QQQ tradingtimemachine.com/tradi…

Trading Time Machine retweeted

PRIORITY FEES HAVE SMASHED THEIR ALL-TIME RECORD, GENERATING $510K IN A SINGLE DAY.

A great view at The View hotel maps.app.goo.gl/E5FGDsTStau1… , as we make our way to Drama, #Greece to visit a friend.
Trading Time Machine retweeted
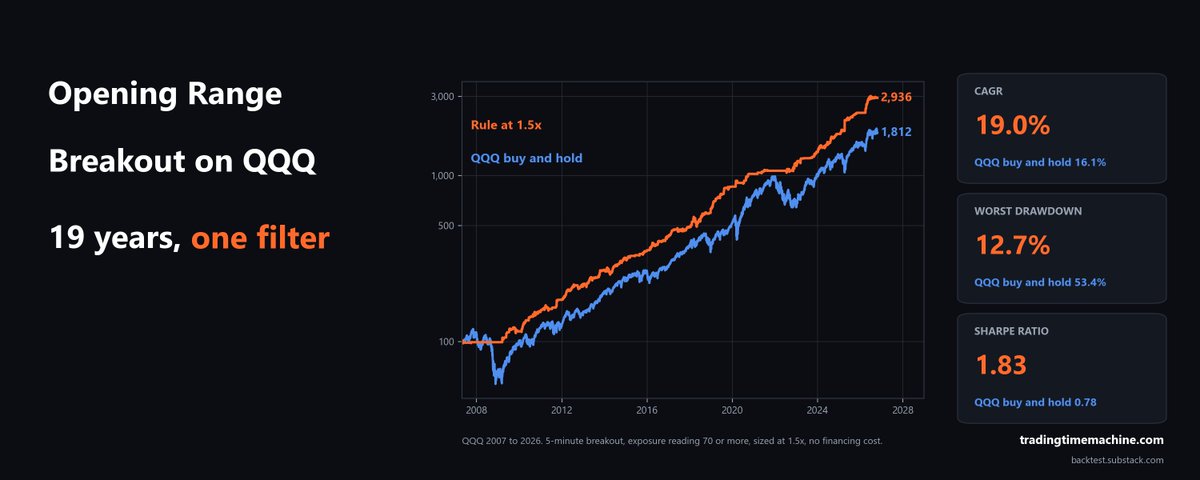
Toby Crabel's rule, 19 years of $QQQ, and the nightly exposure reading that sorts the winning mornings from the losing ones. Sized at 1.5x it made 19.0% a year against 16.1% for buy and hold.
Investors Are Hiding in Safe Stocks Like April 2000. What Came Next? 🤔
Over the past month the 100 steadiest S&P 500 stocks beat the 100 most volatile by 14.6 percentage points.
With the index within 5% of its record, the only wider gap came in April 2000, as the dot-com bubble burst. I tested all 12 earlier cases since 1991.
Read the full article (charts, tables and methodology): backtest.substack.com/p/safe…
$SPY $QQQ
Quiet, low-volatility stocks beat volatile ones by 14.6 points in a month, the widest gap near an S&P 500 record since April 2000. I tested what came next. $SPY $QQQ $NOW $FTNT $INTC $GOOG
nitter.gq/thetrading/status/2116…


Quiet, low-volatility stocks beat volatile ones by 14.6 points in a month, the widest gap near an S&P 500 record since April 2000. I tested what came next.
$SPY Yesterday's exposure was relatively low at 42.8% and the nightly reading jumped a bit to 54.8% in last nights email.
Historically, gaps down 0.75%–1.55% with prior-session exposure of 45%–65% produced 84 matches.
By the fifth session’s close:
• 59.5% winners
• Avg win: +2.21%
• Avg loss: −1.69%
• Profit factor: 1.92
Not huge, but a lean off todays open price.
All returns measured from the opening price.
$QQQ $NVDA
🤖 Made with AI


Toby Crabel's rule, 19 years of $QQQ, and the nightly exposure reading that sorts the winning mornings from the losing ones. Sized at 1.5x it made 19.0% a year against 16.1% for buy and hold.
Trading Time Machine retweeted

The dot-com bust crushed the Nasdaq in 2000, but my KJ Custom strategy kept advancing.
And this isn't survivorship-biased data. I'm using historical index constituents, not today's winners retroactively.
A good reminder of why realistic backtesting matters.
#WealthLab #AlgoTrading

Trading Time Machine retweeted

Effective Immediately, all organizations using PHP for their systems are advised to be prepared for an update addressing two critical vulnerabilities. PHP is widely used for web applications. These vulnerabilities often provide a direct path to the server's file system or database. If an immediate update is not feasible, it is recommend that organizations take the system offline until it can be fully mitigated. NSA will follow up shortly with more specific guidance.
Pick any minute of the trading day. By chance it has a 1 in 390 shot at being the high of the day, and the same shot at being the low.
The 9:30 minute, the very first one, has been the high or low of $SPY's day 14% of the time since 2007. The last minute, 3:59, 13%.
Add up the first 5 minutes and the last 5. That's 10 of the 390 one minute bars, and they set the high or low on 40% of days. Chance says 5%.
The first and last half hour: 73%. Chance says 28%.
$QQQ in the same order: 1 Minute -17%, 11% - 5 Minute 42%, 76%.
Conversely, why are mid-day bars less probable of marking the high or low of the day? Would LOVE your feedback!
#thinkaboutit

I post a free nightly market forecast built from real backtests: tradingtimemachine.com/tradi…
Through the years, online and off, I’ve seen and heard many trying build various versions of an intraday Opening Range Breakout (ORB) system. I’ve been trading mine automated for almost 17 years. (some execution tweaks along the way).
One of the areas I see others get bogged down on are the filters. As many of you know, I recently shared my nightly Exposure reading. Having a quantifiable number going in to the trading day is critical to developing a rules based ORB system (IMO).
Over the coming days, on my substack, we’ll be discussing some rules and performance numbers. I can’t give away all the secrets, but I guarantee you’ll learn things that are not available publicly anywhere else.
The system uses both $SPY and $QQQ long/short.
To get the free Exposure reading and forecast for yourself - head over to the site. That number is critical to the methodology. tradingtimemachine.com/tradi…

Trading Time Machine retweeted

Two WorldQuant managers ran hundreds of quants for more than a decade, then surveyed their best ones. Habit number one on the list: working hard without even noticing it.
Their smartest hire aced every interview and never became the best. The ones who kept showing up, year after year, passed him.
Their top people said things like “This feels more like a game to me than work.”
That one I understand. Finding small edges in large datasets is slow, manual work. I dig through the data, start piecing rules together, and the next time I look up it’s morning. The first thing on my mind is getting back to it. $SPY $QQQ #OneMoreBacktest #AlgoTrading #Quant

Trading Time Machine retweeted
SPY has had 203 days with a move of 3% or more since 1993.
They don't show up at random. 41 came in 2008. 26 in 2020. Twelve full years had none at all.
After a calm day, the chance of a 3% day sometime in the next week is 4%.
After a 3% day, it's 57%.
Direction is a different story. After a 3% drop, SPY was up the next day 60% of the time. You can't call which way it goes. You can call how hard it moves.
That's why position size should come from recent volatility, not from a fixed number of shares. A system holding the same size in March 2020 that it held in a calm 2017 is taking several times the risk without knowing it.
Forecast the size of the move. Leave the direction to the system.

Trading Time Machine retweeted
Here’s an odd one.
Uranium stocks $URA are down 15% in a month. Rare earth stocks $REMX sit 37% below their 200-day average.
Both crashing at once has happened 17 times since 2011. Two weeks later $SPY was higher in all 17, up 4.3% on average. A normal two weeks is +0.6%.
It didn’t need a selloff. With SPY near its high, it was still 8 for 8, up 3.1% on average.
Each one alone was followed by a gain about 70% of the time. Together, 17 for 17. The latest started October 14.
