

Transform your data into interactive SVG images, animated GIFs and still PNGs that you can easily insert on your websites, presentations and social media.
Joined September 2018
- Tweets73
- Following304
- Followers42
- Likes0


Interactive chart made with visuagic.com showing the top countries by CO2 emissions. #CO2 #climatechange
Quick presentation of the new features of the visuagic.com chart maker. #charts #OpenData #dataviz #DataAnalytics
29
Quick presentation of the new features of the Visuagic.com chart maker. #charts #OpenData #dataviz #DataAnalytics
youtu.be/luU9fnnbu88
Quick overview of the new Visuagic interface:
youtu.be/jWTLiG1NMXU
Did you know that you can make your own charts in just 5 steps and for free.
app.visuagic.com/
#Chart #charts #news #Statistics #journalists #tools

Hello everyone, we are excited to show the update of our page, in which you can create your own chart.
app.visuagic.com/
#chartidea #ChartoftheDay #Statistics #Chartmaker #free #GIF


With Visuagic.com transform your data into interactive SVG images, animated GIFs and still PNGs that you can easily insert on your websites, presentations and social media #Datavisualization #OpenData #charts #MAPS
Visuagic retweeted

20 days left to support @rawgraphs!
If you don't know this excellent tool yet: You'll make better #dataviz with it. Try it out: rawgraphs.io/
If you know RAW already: You know you've made better data viz thanks to it. So give them some money: indiegogo.com/projects/rawgr…

Comparativa de los resultados del 2019N con los anteriores del 2019A
#EleccionesNoviembre2019 #10N #eleccionesgenerales10N
@PanelElectoral @electo_mania

Comparativa de resultados de las elecciones generales desde 1977
#EleccionesNoviembre2019 #10N #eleccionesgenerales10N
@PanelElectoral @electo_mania
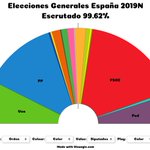
Resultados con el 99.62% escrutado
#EleccionesNoviembre2019 #10N #eleccionesgenerales10N @PanelElectoral @electo_mania


We are now working on improving the documentation of the application and the chart creation process.
visuagic.com/help/how-to-cre…
A different way of presenting a map of the Wold showing the % of Women in National Parliament #women #WomensRights #politics #genderequality, data from @undata
#OpenData @UN_Data @UN_Women #charts #Map @EU_DataPortal @EU_opendata @usdatagov @opendatacharter


