





The weekly Coppock Curve has a bullish bias for only three of the S&P's 11 sectors - healthcare, telecom, & utes.
FWIW, the 7-day ma of new US covid cases is 40% greater than the summer's peak and almost 3x the spring high.
NYSE electoral college. DJIA up almost 400 points but NYSE DVOL exceeded UVOL. (That's meant to be humorous, not political.)
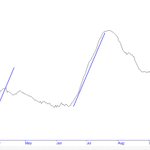
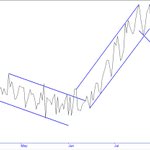
Covid and TA? This chart has the 7-day ma of new cases nationally with parallel trend lines. Not perfect; just an observation.

1
5
The monthly Coppock Curve has a bearish bias for 19 of the 30 DJIA stocks and 8 of the 11 S&P sectors.
1
7

Misspelled his name "Drumpf"


2
3
Two weeks ago today, the S&P just missed making an all-time high. Today, there were more new NYSE 52-week lows than 52-week highs. More than half of the 500 stocks are at least 10% below their 52-week high.
Just for the record, Rosie, the weekly cumulative a/d lines for the S&P 500, S&P 1500, and S&P 400 (mid cap) indexes are at all time highs. The S&P 600 (small cap) is a hair's "breadth" away. (Enjoyed listening to the call.)

FYI, 23 of the 30 DJIA stocks have a bearish bias on their weekly Coppock Curve. That is the most since April.
Today's decline effectively ruled out a fourth wave correction count, satisfied the minimum requirements for a complete pattern from the March low, and opened the door for a Fibonacci retrace of the entire Mar-Sep rally.
Coppock update: the weekly oscillator has a bearish bias for 10 of the S&P 500's 11 economic sectors.
10
One strong down day within an uptrend and NASDAQ records more 52-week lows than highs (for the first time since May).
8
