


Pinned Tweet
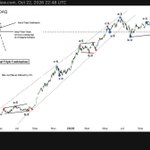
$BTC : Bitcoin’s 24-Year Master Structure: What Could Happen by 2033 ?
I’ve updated my chart to make the entire structure clearer, showing how Bitcoin’s standard 4-year cycles may fit into a much larger framework.
This is the bigger picture I’ve been studying since the beginning.
1. The First 12-Year Structure: 2009–2021
Bitcoin’s first ~12-year structure consisted of three standard 4-year cycles.
But something unusual happened during the middle 4-year cycle: Bitcoin experienced a prolonged bearish phase between 2013 and 2015.
This is an important detail in my analysis.
The unusual event occurred during the second of the three standard cycles within the larger 12-year structure.
2. The Second 12-Year Structure: 2021–2033
Bitcoin then entered its second potential ~12-year structure, again consisting of three standard 4-year cycles:
* 2021–2025: First 4-year cycle — completed.
* 2025–2029: Second 4-year cycle — currently unfolding.
* 2029–2033: Third 4-year cycle — projected.
Notice the parallel.
We are now in the middle 4-year cycle of the second ~12-year structure, just as the 2013–2015 prolonged bearish phase occurred during the middle cycle of the first structure.
This is the foundation of my current thesis.
I believe the second structure could repeat this unusual feature, with another prolonged bearish phase potentially developing during 2025–2027.
3. The Complete 24-Year Structure: 2009–2033
Now let’s put everything together.
According to my framework, the larger structure can be divided into:
* 6 × 4-year cycles = one potential 24-year full cycle.
* 2 × 12-year structures = each containing 3 × 4-year cycles.
* 1 × 24-year master structure = connecting all six 4-year cycles.
In simple terms:
2009–2021: First 12-year structure, containing three 4-year cycles.
2021–2033: Second 12-year structure, also containing three 4-year cycles.
2009–2033: One potential 24-year full cycle, containing six 4-year cycles in total.
And here is the detail that makes this framework particularly interesting to me:
Within each 12-year structure, the middle 4-year cycle could contain an unusual prolonged bearish phase.
We observed this pattern in the first structure, with the prolonged bear market of 2013–2015 occurring during its middle cycle.
Now we are in the middle 4-year cycle of the second 12-year structure, spanning approximately 2025–2029. My hypothesis is that another prolonged bearish phase could develop during 2025–2027.
4. The 2033 Peak: A Potential Structural Turning Point
There is another important detail marked on my chart: the compression of Bitcoin’s historical trend angles.
According to my projections, by the potential 2033 peak, these trend angles could compress toward approximately 1.86°.
This is particularly interesting because it raises a bigger question about Bitcoin’s long-term growth structure.
What if the cycle following the completion of the 24-year structure is no longer capable of producing another meaningful new all-time high in the way previous cycles have?
Instead, could Bitcoin form a double top, with the next major peak approaching a level comparable to the previous one rather than delivering another significant expansion?
It could mark the point at which Bitcoin’s historical market structure begins transitioning into something fundamentally different.
5. The Bigger Question: What Happens After 24 Years?
This brings everything together.
If Bitcoin completes two ~12-year structures, six 4-year cycles, and one potential 24-year master structure around 2033, while its historical trend angles compress toward approximately 1.86°, could we be approaching a major structural transition?
Perhaps the cycle that follows after 2033 will behave differently from the cycles we have observed since Bitcoin’s early years.
Maybe Bitcoin’s 24-year structure will not simply end another cycle. Maybe it will mark the beginning of a fundamentally different phase in Bitcoin’s history.


$BTC : this could be very interesting.
The 12-year cycle / structure is something I’ve been looking at since the beginning, and it was one of the main reasons I expected the current cycle to develop as a prolonged bearish cycle similar to 2013–2015.
I’ve already explained Bitcoin’s larger ~12-year structure in my previous posts, especially in the quoted post, so I won’t repeat that part here.
What I find interesting now is the number 12 itself.
Think about a clock.
A clock has 12 numbers, and after 12 hours, we complete half of the daily cycle and enter a different phase.
Day becomes night.
Night becomes day.
Light changes.
Temperature changes.
Human activity changes.
The environment can look completely different even though the underlying 24-hour cycle is still repeating.
So 12 is not simply an arbitrary number.
It represents an important point within a repeating cycle.
Now look at Bitcoin’s larger structure.
The first ~12-year structure ran from roughly 2010 to 2022.
Since the 2022 bottom, Bitcoin has potentially been developing its second ~12-year structure, which could mature around 2033–2034.
During the first structure, we saw the unusual 2013–2015 prolonged bearish phase.
My thesis is that the current 2022–2034 structure could follow a similar path, with another prolonged bearish cycle developing during 2025–2027.
And if this framework continues to hold, 2033–2034 could become a major structural transition point — when the second 12-year structure matures and Bitcoin’s trend angles potentially compress toward zero.
But here’s where it gets even more interesting.
By 2033–2034, we would have approximately 24 years of Bitcoin history across two consecutive 12-year structures.
And what does a day have?
24 hours.
After 24 hours, the daily cycle is completed and a new day begins.
So we get this interesting numerical relationship:
~4 years → standard cycle
~12 years → larger structure
~24 years → two larger structures / potential larger transition
This is why I’m saying the 4-year cycle could remain active within this larger framework until around 2033–2034, while at the same time Bitcoin’s trend-angle compression could continue toward zero.
If that happens, 2033–2034 could represent the completion of the larger 24-year structural period and potentially a point where the market’s character changes.
Similar to the clock analogy: once 24 hours are completed, the current day ends and a new day begins.
I’m not saying the numbers themselves cause Bitcoin’s cycles.
The clock is simply an interesting analogy for the rhythm I’m observing in the historical structure.
We have:
4 → 12 → 24
Maybe Bitcoin doesn’t have just a cycle.
Maybe it has a cycle of cycles — and a larger clock above it.
And if this framework continues to hold, 2033–2034 could be one of the most interesting structural transition points in Bitcoin’s long-term history.

Please be careful, everyone!
This person was scammed by someone impersonating me, who offered him VIP access and took advantage of the situation. Unfortunately, he initially blamed me for something I had nothing to do with.
I accept his apology and forgive him. Despite being scammed by an impersonator, he came straight to my comments and insulted me. However, I understand that emotions can get the better of us, and none of us is perfect. We all make mistakes.
Let’s learn from this and move forward.
IMPORTANT: I WILL NEVER DM YOU FIRST!
If anyone messages you first pretending to be me and offers VIP access, paid services, or anything similar, it is a scammer.
And @wick_btc is my only account.
Never send money to anyone claiming to represent me.
Stay safe and always verify who you’re talking to!

$ETH Update:
ETH has reached almost exactly the expected target zone.
In my previous 1H LTF analysis, I identified the $2,390 area as a potential second recovery target. I also highlighted the $2,400 region in my earlier 1D analysis quoted below.
ETH ultimately reached $2,387 before facing rejection.
$ETH 1D Update:
Ethereum appears to be developing a broader corrective structure similar to Bitcoin, with both charts exhibiting characteristics of a Double Combination.
Several structural similarities are becoming increasingly notable:
Extended initial phase: The first corrective pattern developed into an elongated structure.
X-wave: A contracting triangle appears to connect the two corrective patterns.
Final triangle: ETH appears to be forming the final phase of the combination. Waves A, B, and C seem to be complete, while Wave D may be approaching completion.
According to NeoWave framework, Double and Triple Combinations that begin with a Flat can conclude with a triangle. Within these structures, the B-wave baseline is particularly important for monitoring price development, and ETH has already broken below this baseline.
However, the initial breakdown may have been a false break. Price subsequently recovered above the baseline during Wave C before declining again to develop Wave D, which appears to be in progress.
If this interpretation remains valid, the next and final step could be Wave E, potentially completing the triangle before a larger bearish impulse begins.
What comes next?
ETH could recover toward the $2,400 region, potentially completing Wave E and bringing the broader structure to an end.
If this scenario unfolds, the completion of the Double Combination could precede a more substantial downside move, consistent with the broader bearish scenario outlined for BTC.

PLEASE BE CAREFUL!
There are fake accounts impersonating me and trying to sell VIP access under my name.
Please do not send them any money!
Keep in mind that @wick_btc is my only official account. I will never DM you first or approach you privately to offer VIP access or ask for money.
Stay vigilant, protect yourselves, and always double-check the account before trusting anyone claiming to be me.
Thank you for your support!
$BTC 4H Update:
Price followed the alternative scenario outlined in my previous analysis, extending lower toward the $79K zone before bouncing back.
The recovery has now successfully reached the first target at $81.8K, with the latest price reached so far 81,823$ , in line with the anticipated Wave E scenario.
The second target at $82.2K remains ahead. We’ll be watching closely to see whether BTC reaches this level before expected bearish continuation begins.
$BTC 4H Update:
The anticipated Wave C failure has played out as expected, providing an important clue about Bitcoin’s broader corrective structure.
This supports the interpretation that the current structure may be developing as a Double Combination.
The structure appears to exhibit the following characteristics:
Elongated initial phase: An extended impulse forms the first part of the combination.
X-wave: A contracting triangle connects the two corrective patterns.
Wave C failure: The latest C-wave failure appears to be part of the triangle formation, further supporting this interpretation.
According to NeoWave theory, most Double and Triple Combinations conclude with a triangle. A break of the B-wave baseline can signal that the structure is approaching completion. However, the final segments of a triangle can produce one or more false breaks of the baseline before the pattern is completed.
This is particularly relevant to the current BTC price action.
Price has already broken below the lower boundary, but this does not necessarily mean that the larger decline must begin immediately. The triangle may still be developing as the final phase of the broader corrective formation.
In the current scenario, Waves A, B, and C appear to be complete, while Wave D is approaching completion. Wave E could follow before the triangle completes and the anticipated larger decline begins.
What comes next?
BTC could recover toward $81.8K–$82.2K from current levels, potentially completing Wave E. Alternatively, price could first extend lower toward $79K–$78K, with this move potentially representing a false break before the anticipated recovery.
If this scenario plays out, the completed triangle could then be followed by a final downside breakdown, potentially opening the door to a more substantial decline.

$PEPE update : +15% so far.

$PEPE LTF Update:
Under the NeoWave framework, PEPE’s current structure appears to be developing as a Triple Zigzag.
The textbook describes a key characteristic of this pattern: a well-contained movement of multiple advances and declines between two parallel lines will usually indicate a Double or Triple Zigzag.
PEPE’s current price structure appears to align with this principle, as price continues to develop a series of advances and declines within a well-defined ascending channel.
Approximately 50% of the projected structure has developed, suggesting that a substantial portion of the formation may still lie ahead.
At present, the decline appears to be forming Wave B. If this interpretation holds, PEPE may have further upside potential before the structure reaches completion.

$ZRO 4H Update:
The current structure appears to align with a 5th Extension Terminal Impulse pattern.
The advance from the August lows has developed into a complex structure, with potential subdivisions labeled 1:3, 2:3, 3:3, 4:3, and 5:3. One of the key characteristics supporting this interpretation is the overlap between Waves 2 and 4, which is consistent with the terminal formation illustrated in the textbook.
The potential fifth-wave extension appears to have reached completion near $2.40. However, a final recovery toward the $2.13–$2.22 resistance zone remains possible before the broader reversal develops.
An important principle: the textbook specifies a minimum retracement of 100% of the completed terminal formation. If this interpretation is correct, the subsequent reversal could retrace the entire terminal structure back to its origin, rather than merely correcting the fifth wave.
Based on the current count, the $0.75–$1.05 region represents a potential downside area to monitor, depending on the confirmed starting point of the terminal formation.

$MU Update:
The relief bounce is underway, with a recovery of approximately +6% reaching 930$ so far. The maximum potential recovery could extend toward the previously mentioned $970 area.
Price appears to be developing the expected final Wave E of the broader Triple Combination structure.
Once Wave E is complete, the entire corrective structure could be nearing completion, potentially setting the stage for a major bearish move.
$MU HTF update:
Based on the NEoWave framework, Micron Technology appears to be developing a potential Triple Combination, similar to SNDK. As you may have noticed, these two stocks tend to move together.
The proposed structure consists of two Zigzags followed by a Triangle, with the corrective phases connected by X-waves.
Looking at the chart, we can identify two completed Zigzags, connected by X-waves. The final component of this pattern is a Triangle, and the ABCDE structure appears to be developing now.
Waves A, B, and C are complete, while Wave D appears to be approaching completion. This leaves room for a potential relief bounce toward the $970–$1,028 region before Wave E completes the Triangle.
What comes next?
Once the Triangle is complete, I’ll be watching for confirmation of the bearish setup. A break below the B–B baseline could provide an important signal that the entire structure has finished and a deeper corrective phase may be beginning.
If this interpretation plays out, my projected downside zones are:
• $530 — initial reference level
• $448–$410 — intermediate downside zone
• $366 — lower target zone

$SNDK Update:
The relief bounce is underway, with a recovery of approximately +6% so far. The maximum potential recovery could extend toward the $1,350 area.
Price appears to be developing the expected final Wave E of the broader Triple Combination structure. Once this final phase is complete, the entire structure could be nearing completion, potentially setting the stage for a major bearish move.
$SNDK HTF Update:
If you remember my previous posts, I warned that a corrective phase had begun when SNDK was trading around $1,600. Since then, price has already declined by approximately 25%.
Based on the NeoWave framework, the current structure appears to be developing as a Triple Combination: two Zigzags followed by a Triangle, with each corrective phase separated by an X-wave.
Looking at the chart, we can identify the two Zigzags and the intervening X-waves. The final component — an ABCDE Triangle — is currently developing.
Waves A, B, and C are complete, while Wave D appears to be approaching completion. This leaves room for a small relief bounce before the final leg of the Triangle, Wave E, potentially completes the entire corrective structure.
Once the Triangle is complete, I expect bearish continuation, with a projected downside target in the $510–$600 range.
This is the same bottom-target zone I mentioned in my earlier analysis.

$ETH 1D Update:
Ethereum appears to be developing a broader corrective structure similar to Bitcoin, with both charts exhibiting characteristics of a Double Combination.
Several structural similarities are becoming increasingly notable:
Extended initial phase: The first corrective pattern developed into an elongated structure.
X-wave: A contracting triangle appears to connect the two corrective patterns.
Final triangle: ETH appears to be forming the final phase of the combination. Waves A, B, and C seem to be complete, while Wave D may be approaching completion.
According to NeoWave framework, Double and Triple Combinations that begin with a Flat can conclude with a triangle. Within these structures, the B-wave baseline is particularly important for monitoring price development, and ETH has already broken below this baseline.
However, the initial breakdown may have been a false break. Price subsequently recovered above the baseline during Wave C before declining again to develop Wave D, which appears to be in progress.
If this interpretation remains valid, the next and final step could be Wave E, potentially completing the triangle before a larger bearish impulse begins.
What comes next?
ETH could recover toward the $2,400 region, potentially completing Wave E and bringing the broader structure to an end.
If this scenario unfolds, the completion of the Double Combination could precede a more substantial downside move, consistent with the broader bearish scenario outlined for BTC.
$BTC 4H Update:
The anticipated Wave C failure has played out as expected, providing an important clue about Bitcoin’s broader corrective structure.
This supports the interpretation that the current structure may be developing as a Double Combination.
The structure appears to exhibit the following characteristics:
Elongated initial phase: An extended impulse forms the first part of the combination.
X-wave: A contracting triangle connects the two corrective patterns.
Wave C failure: The latest C-wave failure appears to be part of the triangle formation, further supporting this interpretation.
According to NeoWave theory, most Double and Triple Combinations conclude with a triangle. A break of the B-wave baseline can signal that the structure is approaching completion. However, the final segments of a triangle can produce one or more false breaks of the baseline before the pattern is completed.
This is particularly relevant to the current BTC price action.
Price has already broken below the lower boundary, but this does not necessarily mean that the larger decline must begin immediately. The triangle may still be developing as the final phase of the broader corrective formation.
In the current scenario, Waves A, B, and C appear to be complete, while Wave D is approaching completion. Wave E could follow before the triangle completes and the anticipated larger decline begins.
What comes next?
BTC could recover toward $81.8K–$82.2K from current levels, potentially completing Wave E. Alternatively, price could first extend lower toward $79K–$78K, with this move potentially representing a false break before the anticipated recovery.
If this scenario plays out, the completed triangle could then be followed by a final downside breakdown, potentially opening the door to a more substantial decline.
$AAVE HTF Update:
The current structure appears to be developing as a Double Combination.
Looking at AAVE’s 2022 price action, we can observe a completed example of this structure. The 2026 formation appears to be following a similar path, with the same key phases developing in sequence.
The main difference is time. The current structure is taking considerably longer to develop than its 2022 counterpart, which aligns with my original thesis that this bearish phase could be prolonged.
Let’s break down the structure and the rules behind this interpretation.
Phase 1 — Elongated Flat
The first phase consists of an elongated flat, characterized by an extended corrective formation. We can identify a similar development in both the 2022 and 2026 structures.
Phase 2 — Triangle Formation
Following the elongated flat, the structure develops into a triangle. The completion of this triangle, followed by the subsequent directional move, marks the expected end of the Double Combination.
In the 2022 example, this sequence played out before AAVE established its major bottom. In the current structure, the triangle appears to be the next phase, potentially developing over the coming months near the projected $24–35 bottom zone.
Why an Impulse Count Does Not Fit
The alternative interpretation as a standard five-wave impulse does not satisfy several important guidelines illustrated in the NeoWave textbook.
• Wave 2 retraces too much of Wave 1, making the proposed impulsive interpretation problematic.
• Wave C is too simple relative to Wave A, unless the structure is still developing into a triangle.
• The proposed Wave 3 extension is insufficient. In the textbook example, an extended third wave would normally reach at least 161.8% of the next-longest impulse segment. The illustrated count fails to meet that guideline.
These inconsistencies weaken the impulsive interpretation and support considering a complex corrective structure instead.
What Comes Next?
If the 2026 structure continues to follow the 2022 analogue, the potential triangle formation remains ahead of us. Its completion could coincide with the final stage of the broader decline, with the $24–35 region serving as the current projected bottom zone.
The key point is not simply that the two structures look similar. It is that their internal phases appear to be developing in a comparable sequence, while the current formation is taking longer to complete.

$PEPE LTF Update:
Under the NeoWave framework, PEPE’s current structure appears to be developing as a Triple Zigzag.
The textbook describes a key characteristic of this pattern: a well-contained movement of multiple advances and declines between two parallel lines will usually indicate a Double or Triple Zigzag.
PEPE’s current price structure appears to align with this principle, as price continues to develop a series of advances and declines within a well-defined ascending channel.
Approximately 50% of the projected structure has developed, suggesting that a substantial portion of the formation may still lie ahead.
At present, the decline appears to be forming Wave B. If this interpretation holds, PEPE may have further upside potential before the structure reaches completion.
$BTC 4H Update:
Price followed the alternative scenario outlined in my previous analysis, extending lower toward the $79K zone before bouncing back.
As anticipated, this move provided the potential false-break scenario I discussed, followed by a recovery from the projected downside target.
$BTC 4H Update:
The anticipated Wave C failure has played out as expected, providing an important clue about Bitcoin’s broader corrective structure.
This supports the interpretation that the current structure may be developing as a Double Combination.
The structure appears to exhibit the following characteristics:
Elongated initial phase: An extended impulse forms the first part of the combination.
X-wave: A contracting triangle connects the two corrective patterns.
Wave C failure: The latest C-wave failure appears to be part of the triangle formation, further supporting this interpretation.
According to NeoWave theory, most Double and Triple Combinations conclude with a triangle. A break of the B-wave baseline can signal that the structure is approaching completion. However, the final segments of a triangle can produce one or more false breaks of the baseline before the pattern is completed.
This is particularly relevant to the current BTC price action.
Price has already broken below the lower boundary, but this does not necessarily mean that the larger decline must begin immediately. The triangle may still be developing as the final phase of the broader corrective formation.
In the current scenario, Waves A, B, and C appear to be complete, while Wave D is approaching completion. Wave E could follow before the triangle completes and the anticipated larger decline begins.
What comes next?
BTC could recover toward $81.8K–$82.2K from current levels, potentially completing Wave E. Alternatively, price could first extend lower toward $79K–$78K, with this move potentially representing a false break before the anticipated recovery.
If this scenario plays out, the completed triangle could then be followed by a final downside breakdown, potentially opening the door to a more substantial decline.
$BTC 1D Update:
Bitcoin’s current structure appears to align with the rules outlined in NeoWave theory.
According to this interpretation, when a Flat develops with a C-wave failure, the preceding X-wave is most likely to take the form of a Triangle or a Monowave.
The chart appears to fit this scenario:
X-wave: A contracting triangle, consistent with the NeoWave pattern.
Post-triangle advance: Price rallies to a new high, potentially forming the final corrective structure.
C-wave failure: It could occur if the current structure continues to unfold as anticipated.
NeoWave also emphasizes structural complexity: the X-wave should be at least as complex as the preceding C-wave, but no more complex than the most complex standard pattern within the entire formation.
This is what makes the current BTC structure interesting: the price action so far appears to align with this interpretation, while the anticipated C-wave failure is still ahead of us.
If the scenario plays out, it could open the door to further downside rather than a sustained bullish breakout.

$ETH LTF 1H Update:
The setup was initially shared around $2,548, with $2,563 marked as a potential rejection zone and the starting point for bearish continuation.
Price first swept liquidity around $2,579 before declining into the previously identified $2,261 target zone. The lowest price reached so far was approximately $2,281.
As outlined in the original analysis, this area could provide the conditions for a temporary recovery before bearish continuation.
So far, ETH has recovered from $2,281 to approximately $2,371.
Potential Recovery Targets:
• $2,347 — First target successfully reached
• $2,398 — Second recovery target remains in focus
We’ll continue monitoring price action closely to see whether ETH extends its recovery toward $2,398 before the next potential decline.
$ETH LTF 1H Setup:
Expect high volatility throughout the entire move, as usual.
Remember, these LTF setups are just additional analysis alongside our main swing sell setup, which was filled at $2,660.
I’m sharing these LTF analyses to keep us engaged and give us something to work on together while we wait for our main swing setup to play out.

$BTC : Wave C Failure Confirmed:
$BTC 1D Update:
Bitcoin’s current structure appears to align with the rules outlined in NeoWave theory.
According to this interpretation, when a Flat develops with a C-wave failure, the preceding X-wave is most likely to take the form of a Triangle or a Monowave.
The chart appears to fit this scenario:
X-wave: A contracting triangle, consistent with the NeoWave pattern.
Post-triangle advance: Price rallies to a new high, potentially forming the final corrective structure.
C-wave failure: It could occur if the current structure continues to unfold as anticipated.
NeoWave also emphasizes structural complexity: the X-wave should be at least as complex as the preceding C-wave, but no more complex than the most complex standard pattern within the entire formation.
This is what makes the current BTC structure interesting: the price action so far appears to align with this interpretation, while the anticipated C-wave failure is still ahead of us.
If the scenario plays out, it could open the door to further downside rather than a sustained bullish breakout.
This is extremely important because even a single large-cap altcoin can provide valuable clues about when a major decline across the broader market could begin.
As you know, large-cap altcoins tend to follow Bitcoin’s broader market direction. Therefore, if $NEAR is approaching the end of its current structure and preparing to enter another corrective phase, this could also signal that the broader crypto market is approaching a similar turning point.
This is exactly why analysing multiple large-cap altcoins is so important. Focusing exclusively on Bitcoin can leave you overlooking valuable structural and timing signals that are already developing elsewhere in the market.
The more assets we analyse, the better our understanding of the broader market structure becomes — and the better positioned we may be to anticipate when the next major decline could begin.
$BTC
$NEAR Timing matters.
The correction began as expected, with a 12% decline so far. But this is just the beginning.
I expect a major decline across altcoins over the coming days, particularly among large caps.
As I’ve said before, we shouldn’t focus exclusively on Bitcoin. Large-cap altcoins deserve close attention because their price structures can provide important signals about what’s coming next for the broader market.
$NEAR LTF 4H Update:
Under the NeoWave framework, the current price structure appears to be developing as a double zigzag combination. Each phase follows a similar pattern, with these phases potentially combining into a larger double zigzag structure on higher timeframes.
Here’s what we have so far:
Structure 1: A double zigzag that lasted 62 days and 4 hours, followed by a corrective phase that lasted 69 days and 4 hours, during which price eventually declined by approximately 50%.
Structure 2: After that corrective phase ended, price began developing another double zigzag combination. This structure has now lasted 61 days and 16 hours, and we are already seeing signs of weakness in price action.
As the current structure approaches the 62–63-day timeframe, another major decline could begin within the next day.
Of course, timing is never perfect. However, the structural similarities and timing alignment are becoming increasingly clear, and this is the scenario I believe we should continue to monitor.
If the pattern continues to unfold as expected, the current structure could be followed by another corrective phase lasting approximately another 69 days, similar to the previous one. From current levels, we could then see another 50–60% decline, potentially pushing $NEAR toward $3 or even lower.

$LIT HTF Update:
LIT appears to be developing a potential Triple Combination.
The proposed structure consists of two Zigzags followed by a Triangle, with the corrective phases connected by X-waves.
According to NEoWave rules, one of the two X-waves can potentially develop into a Triangle. This is what we appear to be seeing in the first X-wave.
Looking at the chart, we can identify two completed Zigzags connected by X-waves. The final component is a Triangle, and its ABCDE structure now appears to be developing.
Once the Triangle is complete, I expect a major decline to follow.
The B–B baseline has already been broken to the downside, suggesting that the pattern is approaching its final stages.
My primary downside target zone is $1.86–$1.49, where I’ll be watching for the completion of this larger corrective structure.

$BTC $USDT.D
This also explains the unusual market behavior over the past 20 days. The sharp back-and-forth volatility could be a sign of a developing Triangle formation.
However, this structure appears to be nearing completion, meaning we could soon see a strong impulsive move and a breakout from the Triangle.
$USDT.D LTF 4H Update:
USDT Dominance appears to be developing a Double Combination within the NEoWave framework.
Here’s how I interpret the current structure:
Phase 1 — Elongated Flat
The first phase appears to have completed as an Elongated Flat. The aggressive decline in USDT.D supports this interpretation.
Phase 2 — Triangle Formation
The current chart shows signs of a developing Triangle. Waves a:3, b:3, and c:3 appear to be complete, while d:3 is currently in progress.
Once wave D completes, we could see the final wave e:3, marking the last stage of the Triangle.
What about the alternative Impulse interpretation?
According to the NEoWave guideline illustrated in Figure 8-6, an extended wave 3 (C:3) would normally measure at least 161.8% or more of the next-longest impulse segment, in this case wave 5 (a:3).
Based on my measurements, wave 3 (C:3) is 167.9% of wave 5 (a:3), satisfying this length guideline for an extended third wave.
What comes next?
Once wave D completes, I’ll be watching for the potential development of wave E.
As illustrated in NEoWave Figure 8-6, the price action following the completed pattern will provide important evidence for determining whether a Complex Correction has formed rather than an Impulse.
If the Double Combination interpretation is correct, its completion could set the stage for the next bullish phase in USDT Dominance.
