

Information designer at The BMJ. Transforming medical research data into visual treats.
London, England
Joined March 2009
- Tweets1.2K
- Following428
- Followers2.1K
- Likes664





Really loving the tile grid by @jschwabish that is available in @f_l_o_u_r_i_s_h. Such a neat way of presenting data about countries and having them appear the same size. Here's one by my colleage @munkeatlooi on social media bans: public.flourish.studio/visua…

Will Stahl-Timmins retweeted

Interesting project. Infoodgraphic recipes from @will_s_t
behance.net/will-s-t

ALT An intricate infographic visualizes a recipe for chocolate and nut flapacks. Ingredients, prep and method are all depicted with in graphical and diagrammatic form.
Me: Dear stock image library. Do you have an icon of someone palpating a baby bump?
Stock image library: I absolutely have you covered on that!
Small wins.
(From a forthcoming BMJ Infographic on pelvic girdle pain).

We're advertising for a 14hr/week freelance contract, to make our graphs and charts in Illustrator and Flourish. It would suit an early career or mid-weight dataviz designer, more info and application link here:
linkedin.com/jobs/view/44048…
Feeling like a little post-Christmas baking? Try my new visual recipe for orange and almond muffins!
etsy.com/uk/listing/18300915…
Also this is my 10th recipe so you can now get a big discount on the full collection:
etsy.com/uk/listing/18301213…

New visual recipe drop! This one for pasta with fresh pesto and sautéed vegetables. Quite a staple in our house as it's quick to make and we all love it... etsy.com/uk/listing/18225611…

My new graphic, showing several metrics on papers about live tissue training. It was about 4 days work, and I’m always interested in similar commissions. I likely have some availability in the coming months.
Dev talk in:
m.youtube.com/playlist?list=…
Paper: sciencedirect.com/science/ar…

New recipe time! And price reductions! for my visual recipes at bit.ly/visualicious
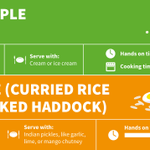
#7: Spiced apple crumble. A easy to make and warming dessert, perfect for this time of year.
#8: Kedgeree. A curried rice dish with smoked haddock, very satisfying and comforting.

Introducing Visualicious Recipes! My new infographics combine flow diagrams, icons, and text, to explain the process of cooking in a different way. Here's a printable freebie of my first recipe. Check out my Etsy shop for more! etsy.com/uk/shop/Visualiciou…

The first #BMJinfographic was published 10 years ago today! To mark the occasion, here’s a thread with 10 of my favourite graphics we’ve made over the last decade [1/12]

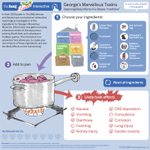
Sometimes simpler is better. This presents only 6 data points, but aims to make them more meaningful by showing the human reality behind them. I wrote more about this graphic with @NadiehBremer here: bit.ly/wst-human [11/12]

Even after 10 years, I feel like we’re only scratching the surface of what’s possible with infographics and data visualisation at the journal. Watch this space for more! Do check our infographics page for the latest: bit.ly/bmj-ig or follow @bmj_latest [12/12]
