

See what the score didn't. xG, xA and xT for every Premier League player, per 90 and ranked by percentile. A full report for every match.
- Tweets1.7K
- Following643
- Followers4K
- Likes1.1K



ALT Premier League expected points table after gameweek 8, ordered by xPts. Manchester City lead on expected points with 16.3. The first column gives each team's real league position, the second where expected points put them, with a teal up arrow for a climb and a red down arrow for a drop; Nottingham Forest climb the most, up 13 places. Delta column shows xPts minus actual points.

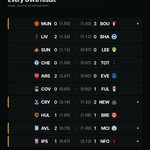
ALT Every Premier League result in gameweek 8, with each side's expected goals. Manchester United 0 (1.93 xG) 3 (1.43 xG) Bournemouth; Liverpool 2 (1.24 xG) 0 (1.12 xG) Brighton; Sunderland 0 (1.12 xG) 0 (0.87 xG) Leeds United; Chelsea 0 (1.00 xG) 2 (0.97 xG) Tottenham Hotspur; Arsenal 2 (2.67 xG) 0 (0.65 xG) Everton; Coventry City 0 (0.60 xG) 1 (0.92 xG) Fulham; Crystal Palace 0 (3.16 xG) 2 (1.32 xG) Newcastle United; Hull City 1 (1.85 xG) 1 (1.68 xG) Brentford; Aston Villa 2 (0.75 xG) 1 (1.95 xG) Manchester City; Ipswich Town 1 (0.87 xG) 1 (3.13 xG) Nottingham Forest. Marked as shock results, where the score did not match the xG: Manchester United against Bournemouth, Crystal Palace against Newcastle United, Aston Villa against Manchester City, Ipswich Town against Nottingham Forest.

ALT Shot map for Liverpool 2-0 Brighton. Expected goals 1.24 to 1.12 from 12 and 16 shots. Each side's shots are drawn in its own colour: hollow off target, solid on target, a football for a goal. Marker size is shot xG. Best chance: C. Kostoulas, 27 minutes, 0.32 xG, blocked.

ALT Cumulative expected goals race chart for Liverpool 2-0 Brighton. Final xG: 1.24 to 1.12. Footballs mark goals, labelled with the scorer.

ALT Shot-by-shot table for Liverpool 2-0 Brighton, every player who had a shot, ordered by total expected goals. C. Gakpo led with 6 shots worth 0.58 xG.

ALT Passing networks for Liverpool 2-0 Brighton. Liverpool completed 226 passes, Brighton 496. Each node sits at a player's average position, sized by how many passes they played or received, and each line's weight is how much those two players passed to each other. The shaded band is where each side's final-third passes went by channel. Liverpool's strongest combination was Wirtz and Gakpo, 11 passes between them. Brighton's strongest combination was Vušković and Verbruggen, 28 passes between them.

ALT How Isak's 20th-minute goal for Liverpool was built, drawn on a pitch attacking left to right: 8 passes and 3 carries over 23 seconds from the opposition half, throw-in. Shot xG 0.22 at a 47 degree angle to goal.


ALT Mamadou Sangaré (Brentford): 23 DefCon against Hull in round 8, the most any player has produced in a Premier League match this season.


ALT Shot map for Manchester United 0-3 Bournemouth. Expected goals 1.93 to 1.43 from 16 and 9 shots. Each side's shots are drawn in its own colour: hollow off target, solid on target, a football for a goal. Marker size is shot xG. Best chance: Matheus Cunha, 72 minutes, 0.58 xG, blocked.

ALT Cumulative expected goals race chart for Manchester United 0-3 Bournemouth. Final xG: 1.93 to 1.43. Footballs mark goals, labelled with the scorer.

ALT Shot-by-shot table for Manchester United 0-3 Bournemouth, every player who had a shot, ordered by total expected goals. Rayan led with 5 shots worth 0.78 xG.

ALT Passing networks for Manchester United 0-3 Bournemouth. Manchester United completed 522 passes, Bournemouth 288. Each node sits at a player's average position, sized by how many passes they played or received, and each line's weight is how much those two players passed to each other. The shaded band is where each side's final-third passes went by channel. Manchester United's strongest combination was Maguire and Yoro, 31 passes between them. Bournemouth's strongest combination was Hill and Silva, 20 passes between them.

ALT How Evanilson's 70th-minute goal for Bournemouth was built, drawn on a pitch attacking left to right: 1 passes and 1 carries over 5 seconds from their own half, open play. Shot xG 0.07 at a 8 degree angle to goal.


