

We are a small team specializing in designing and building user-centric interfaces, apps, and data visualisations from idea to final product.
Zurich, Switzerland
Joined July 2018
- Tweets146
- Following35
- Followers461
- Likes133
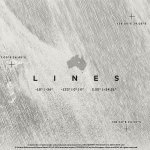


Day 2 of the #30DayMapChallenge: Lines. This is a patch of the Simpson Desert in central Australia. Every line is a sand dune formed by prevailing winds over a very long time. Some of them run for well over 100 km without a break.

ALT A map of a patch of the Simpson Desert in central Australia. Every line is a sand dune formed by prevailing winds over a very long time. Some of them run for well over 100 km without a break. Made for day 2 of the #30daymapchallenge
Happy to join this year’s #30DayMapChallenge! Kicking off Day 1 (Points) with a map of air quality stations in the Po Valley in Italy, coloured by their 2022 average PM2.5.

Many thanks @puntofisso for featuring React Simple Maps in the latest quantum of sollazzo buttondown.com/puntofisso/ar…. Great issue, as always 😎

Started adding examples to the new react-simple-maps.io/ on how to create various thematic maps using React Simple Maps. More stuff coming soon. Have an example you want us to cover? Let us know!

z creative labs retweeted

We visualized the average monthly retail price of electricity ⚡ in the US (Apr 2020 - Apr 2026) as a cartogram where each tile shows the price trend in a specific state as a spark line and can be expanded for a more detailed view. Link to the interactive version👇
z creative labs retweeted
🐧 map: Adélie and Emperor penguins breed around almost the whole coast of Antarctica, while the other three species (Gentoo, Chinstrap, and Macaroni) crowd onto the Antarctic peninsula. Link to interactive version in comments 👇
z creative labs retweeted
noteworthy.graphics is a love project born out of the first #30DayMapChallenge in 2019. We recently decided to pick it up again and use it as our own experimentation ground.
If you're curious to follow along, sign up at noteworthy.graphics for occasional updates.

🌟 React Simple Maps V5 is out 🌟 Now fully typed with split imports so you only ship what you actually need. Additionally V5 comes with many smaller fixes to make your life easier when creating maps #dataviz #maps

🌟 We just shipped V5 of react-simple-maps.io, our open-source React map chart library. Built on top of d3-geo, it provides a layer of flexible components and hooks to create beautiful SVG maps directly in your #react app. If you give it a try, let us know what you think 🌏

Can you name all the European countries on the map 🌍? Try our quiz and find out! If you get stuck, the hints can help by giving you clues such as the capital city, the first letter of the country name, or its ISO3 code:
geography.games/europe-quiz

Last year, we partnered with @developmentseed to bring out the 12th edition of Climatescope by @BloombergNEF. Climatescope is an online market assessment tool, report, and index that evaluates markets’ attractiveness for energy transition investment. global-climatescope.org

It was a pleasure to work with @CarniDC and Rebecca Lamm at @graphicacy_ on this tool for @VoteRunLead to highlight gaps in representation across US State legislatures! Check it out at stateofmydemocracy.org

This Post is from an account that no longer exists. Learn more
z creative labs retweeted

If you need to create beautiful SVG curves or patterns for your next project, try this website.
You get the SVGs and can mix them with CSS or JS to animate them as well.
#webdesign
haikei.app
z creative labs retweeted

So many little design helper sites! css-tricks.com/__trashed/
z creative labs retweeted

Blobs, waves, and blurry gradients are cool as hell.
Haikei makes it real easy to generate these designs and colors.
app.haikei.app/
z creative labs retweeted

I cannnnot tell you how much I LOVE @zcreativelabs' blob maker 🥳 Makes #webdesign elements so joyful!
z creative labs retweeted

I love this: Generate unlimited unique #SVG design assets with @haikei_app by @zcreativelabs haikei.app
z creative labs retweeted

Product Disrupt Newsletter – Mar 2021 • Part 2 featuring @haikei_app by @RichardZimerman & @cristinapoiata
See more here & subscribe 👇
bit.ly/Product-Disrupt-91
#design #newsletter


z creative labs retweeted

In case you missed it, check out Haikei. 🚀 An awesome tool to keep your SVG assets fresh! ⚛️
buff.ly/3cBLf1R
