

Independent investor, my tweets are not an investment advice. Charts, macro-micro, technicals.
Everywhere
Joined March 2011
- Tweets63.2K
- Following423
- Followers21.1K
- Likes67.8K
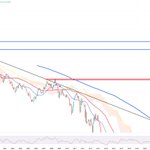




FR10Y...
I have no idea what must happen to buy their bonds...
I can even imagine, full meltdown and dumping EU bonds after this secular break of the bond market. You see also perfectly aligned blue (M)MA200 with this secular trend.
The only one possibility I see in bonds is the USA - because it has reserved currency. Can't imagine looking at those setups buying French bonds (or any other EU bonds or Japanese bonds etc.) because of ANY reasons.


$INTC on (D) ... One of the top "island reversal" pattern I've ever seen...
-32% in a day.
True value is around 10$ in reality...


GregTheAnalyst retweeted
$NVDA
Two crazy levels :
1/ 212$
2/ 35$ (SPX/GOLD cyclical peak)
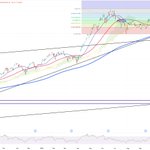
Watch how SPX/GOLD cyclical peak builds crossing with secular bull/bear market border blue (M)MA200
Once we finally leave 212$ level (probably once neoclouds blow up) red (M)MA50 is first stop = 113$
Me : Everything what is > 4Q21 will reverse below it = 35$ for NVDA.
Why? No idea. Pure math and pure technical analysis.


Another 1-2 days like today and Anthropic will be forced to withdraw its IPO...
Amazing how credit tells "JUNK" while retail investors say "FUTURE"
I've learned that BOND market is always right and STOCK market follows BOND market with lag and it always joins where BOND market is.
