

Alerts and Opportunities provided by liquidity. No LLMs used ever.
Joined October 2025
- Tweets1.1K
- Following248
- Followers2K
- Likes500





Pinned Tweet
Well that didn't take long! Hopefully you didn't miss out on this classic move! $QQQ


Alarm bells! ES $SPX Futures will likely need LT6 support at $7,280ish (-4%ish) in the upcoming weeks.


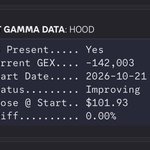
Down 12% so far! Classic response to a gamma squeeze $HOOD

Jmora's noted on $TSLA on the daily!


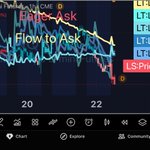
Conditions look very rough on $SPY futures (ES futures) as seen on several timeframes:
Of note:
-bearish liquidity everywhere (candles are red)
- Aggressive ask on the 987-minute
- Bearish liquidity on the weekly
Downside is most likely in the near future, and potentially extending into the next month if LT-6 support is needed on the weekly.

Deep Alpha Alerts retweeted
Conditions look very rough on $SPY futures (ES futures) as seen on several timeframes:
Of note:
-bearish liquidity everywhere (candles are red)
- Aggressive ask on the 987-minute
- Bearish liquidity on the weekly
Downside is most likely in the near future, and potentially extending into the next month if LT-6 support is needed on the weekly.
Composite chats let you directly compare liquidity between symbols. This is done, as in ex below, by setting your chart to, for instance, $SPY / $GME.
When liquidity is bullish (green candles), the top symbol will out perform, and when bearish (red candles) the bottom will outperform.
Check out the daily composite chart below!


Circuit courts rule @OpenAI 's brutalizing of human creativity is not protected against copyright claims.
Thats gonna be One. Big. Beautiful. Bill. !
Weekly $NVDA shows weakness as liquidity turns bearish (Candles are red now) - next supports are located at LT-6 ($187 currently; -12%) & LT-7 ($141 currently; -34%).

Jmora's Sign is when a bulltrap develops, gets rejected by LT resistance, which causes price to fall back below to recent low! On bitcoin:native we see that exact set up!
The weekly view for BTC shows a bulltrap being rejected by LT5/6, and so the next step is likely sub-$55k over the coming months.