
Aktien, Indizes, Rohstoffe, Devisen - Tägliche Chartanalysen, Fundamental- und Konjunkturanalysen
- Tweets10.8K
- Following165
- Followers2.4K
- Likes7


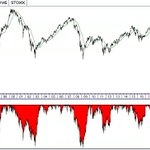
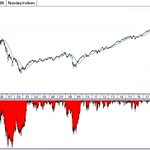
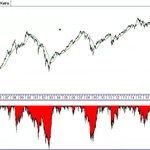
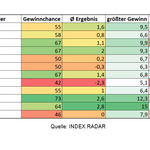


ALT Table showing Nasdaq 100 corrections of 10% or more within 20 trading days of an all-time high since 1986. The latest correction reached 10% in 19 trading days on November 2, 2026. Across 19 completed historical cases, the median maximum drawdown was 13.6%, with a median of 9 additional trading days to the bottom and 44 trading days from the trough to a new all-time high.


ALT Historical S&P 500 performance following midterm elections when Democrats gained control of both the House and Senate. The chart shows 12-month price paths since 1950, alongside forward returns and drawdown statistics. In all 11 prior cases, the S&P 500 gained over the following three months, with a median return of 13.3%.


ALT Bluekurtic Market Insights table showing S&P 500 fourth-quarter performance during midterm election years since 1950, alongside presidential and congressional party control. October was negative in just 5 of 19 historical midterm years, with November positive in all 5. Q4 finished positive in 16 of 19 years (84.2%), with a median gain of 7.9%.