

Tune out the noise. Concentrate on the significant.
Milwaukee, Wisconsin
Joined September 2020
- Tweets175
- Following15
- Followers1.3K
- Likes63




Hi Mount Research retweeted

The market goes through a 4 step process to transition from a downtrend to an uptrend. The process isn't always linear. Retests (step 3) can fail, resetting the process to step 1. In rare cases the market skips step 3, also known as a V-bottom.
Where are we? A 🧵@NDR_Research 1/5

Hi Mount Research retweeted

"While domestic breadth has been uneven, global breadth strength has been resilient. The percentage of global markets above their 50-day average is in the 80’s and the percentage of markets above their 200-day average is in the 90’s."
@WillieDelwiche @HiMountResearch

Hi Mount Research retweeted

🇺🇸 US Breadth 👉 Uneven
🌏 Global breadth 👉 Resilient
The percentage of global markets above their 50-day average is in the 80’s and the percentage of markets above their 200-day average is in the 90’s.
via @WillieDelwiche of @HiMountResearch

Hi Mount Research retweeted

And we know the worst and best days tend to occur next to each other.
So what happens if we miss the best and worst days?
Better returns, lower vol, lesser drawdown. Trend followers are onto something..
h/t @HiMountResearch Aug 2024, @topdowncharts May 2025 and @CarsonGroupLLC Apr 2025


10 worst days in the S&P 500 this decade
What do they all have in common?
They all occurred when the $SPX was below its 200-day moving average

Hi Mount Research retweeted

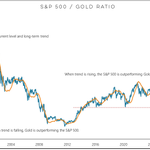
Gold is hitting new highs and its strength has been persistent.
It has outperformed the S&P 500 over the past month, the past year and the past 3 years.
It has also outperformed every sector in the S&P 500 over the past month, the past year and the past 3 years.

Hi Mount Research retweeted
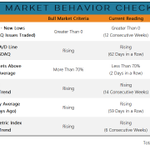
Last week's rally had a feel good quality but it was not enough to turn our sector breadth model positive.

Hi Mount Research retweeted
We've moved out of the breadth regime triggered by last December's spike in new 20-day highs and global market conditions remain challenging.
History suggests that under such conditions weakness from the S&P 500 should not be a surprise. @HiMountResearch

Hi Mount Research retweeted
AAII Bears > Bulls last week for the first time since April and for only the second time this year.
The absence of pessimism is a feature of bull markets.

Hi Mount Research retweeted
New investing regimes have come & gone over past four decades.
The negative relationship between valuations and forward stocks market returns has been persistent.
At 21x, the forward P/E ratio for the S&P 500 is consistent with no net gain for stocks over the coming decade.

Hi Mount Research retweeted
Broad strength has been persistent but doesn't look stretched. New highs have exceeded new lows 72% of the time over the past year. This usually doesn't peak until it gets into the 90s.


Hi Mount Research retweeted
2+ weeks without a 1% swing in S&P 500 is the longest stretch since Jun/Jul.
19 days in a row of NH > NL is the longest stretch since Mar.
I discussed the bullish implications of quiet strength with @Cline_Woods on @SchwabNetwork earlier this week: schwabnetwork.com/video/mark…

Hi Mount Research retweeted
“Increasing equity exposure during periods of trend strength..and reducing equity exposure during periods of trend weakness..is an implementable strategy and achieves the goal of largely sidestepping both the best and worst days in the market.”
h/t @HiMountResearch

Hi Mount Research retweeted

.@WillieDelwiche kicking off MTL with some good charts youtube.com/watch?v=BWhVz1oz…

Hi Mount Research retweeted
Last two times the II bull-bear spread climbed as high as it is now the peak in price was 9 or more months in the future.
Elevated optimism in bull markets is a feature not a bug.

Hi Mount Research retweeted
"It’s been over a decade since the S&P 500 last recorded back-to-back quarterly gains of 10%+. It had only happened a total of seven previous times going back to 1950. None of the previous instances has led to protracted weakness."
@WillieDelwiche @HiMountResearch

Hi Mount Research retweeted

A new edition of “When To Sell”, the classic book by Justin Mamis, has just been released.
All the pages are blank.
Hi Mount Research retweeted
Enjoyed this conversation with @TradersCorner. Give it a listen.

Talking with Traders #podcast. This week I spoke to @WillieDelwiche of HiMount Research to get his market views heading into 2024. Take a listen. Thanks to @IGSouthAfrica for sponsorship.
HTTPS://band.link/IGTraders

Hi Mount Research retweeted
"New lows have exceeded new highs for ten weeks in a row. It’s been seven weeks since we had even a single day with more new highs than new lows. Now volatility is starting to rise, as the S&P 500 moved 1% (or more) three times last week."
@HiMountResearch

