

Interests: Data. Python. Economics. Social Policy. Politics. Australia. Caveats: Not financial advice. Opinions my own. Likes ≠ endorsement.
Canberra, Australia
Joined March 2012
- Tweets9.9K
- Following2.7K
- Followers5.9K
- Likes5K
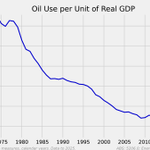




Using less oil per dollar of output means a price shock costs the economy less than in the 1970s. But Australia is more exposed than in the 1970s to the physical supply of oil being cut off.
In the 1970s Bass Strait supplied most of Australia's crude. Today about 90% of liquid fuels are imported, and only two refineries are left (Geelong and Lytton).


Why does the RBA watch the trimmed mean?
The RBA targets headline CPI inflation. But headline inflation is noisy. One-off price shocks push it around: the GST in 2000, free childcare and the fuel price collapse in 2020. A central bank can’t set policy on that noise. It needs a measure of the underlying trend. This is sometimes called core inflation.
The ABS publishes two. The trimmed mean drops the 15% of price changes at each end of the distribution and averages the middle 70%. The weighted median takes the single price change in the middle.
A good underlying measure has to pass three tests.
First, it must not drift from headline over time. If the target is headline, the trend measure has to track it in the long run. Since 1987, the quarterly gap between the trimmed mean and headline averages 0.00 points. The weighted median averages 0.01. Both look unbiased in growth terms.
Second, it must be less volatile than headline. Both underlying measures cut the volatility of quarterly inflation by about two thirds.
Third, it must be persistent. This quarter’s reading should tell you something about next quarter’s. Headline inflation has an autocorrelation of about 0.4. Both underlying measures sit near 0.85.
So why the trimmed mean over the weighted median? On noise and persistence, the median currently wins by a whisker. But the price level chart [see follow-on tweet] shows where the median falls down. It wanders much further from headline. After nearly forty years, the trimmed mean index sits about 1% above headline. The weighted median sits about 1.5% above, and it ran as far as 6% above in 2020. Small biases in quarterly growth compound into large gaps in the price level. For a bank that targets headline, that matters.
The reason lies in how each measure is built. The median rests on one item: whichever price change happens to land in the middle. When the distribution of price changes is lumpy, the middle can jump from one item to another, and the median lurches with it. The trimmed mean uses 70% of the basket. It throws away the outliers but keeps most of the information. That makes it harder to knock off course.
The trimmed mean also has a simpler story. It’s an average with the extremes removed. Anyone can understand that.
So the RBA takes the measure that filters the noise without losing touch with the thing it’s trying to control.
1/2 ...


I expect both the Fed and the RBA to hike again before the end of the year. Both countries have been above target for too long.


The oil price was not in the Q3 trimmed mean - and almost all Australian inflation pressure is domestic - with wages growth > 2.5% target + productivity growth.
A lot of things went wrong, starting in the late 1960s, both here and internationally. What I find particularly interesting is why Australia took a decade longer than the US to escape the mess. Whitlam and Fraser were both hopeless on inflation. Hawke did a bit better, but nowhere near as good as the US under Volker. Keating’s recession we had to have was the Australian, turning point for inflation, but unemployment took another 15 years to settle.
Mark 🇦🇺 retweeted

It’s not often you get the opportunity to follow a former Treasurer on stage and pull apart the case they’ve just made. Wayne Swan told the The @FinancialReview Super & Wealth Summit that the CGT changes are 25 years overdue.
I then joined Rebecca Zwier, John Bongiorno and Michael Fox to explain why we think they’ll have disastrous consequences for the economy. From individual shareholders and business owners to companies raising capital and the property market. I learned from Michael that even the local art market is feeling the pain...
Investors are being pushed out of direct shares and into ETFs and other pooled structures to avoid tax rates as high as 82%. Meanwhile the ASX small cap market is a basket case - these changes will make it even harder for Australian businesses to attract capital and grow.
All four panellists agreed on one thing... hiking CGT isn’t the solution to Australia’s housing and productivity problems.
Thanks to @JoannaMather for leading a great discussion.
🤖 Made with AI


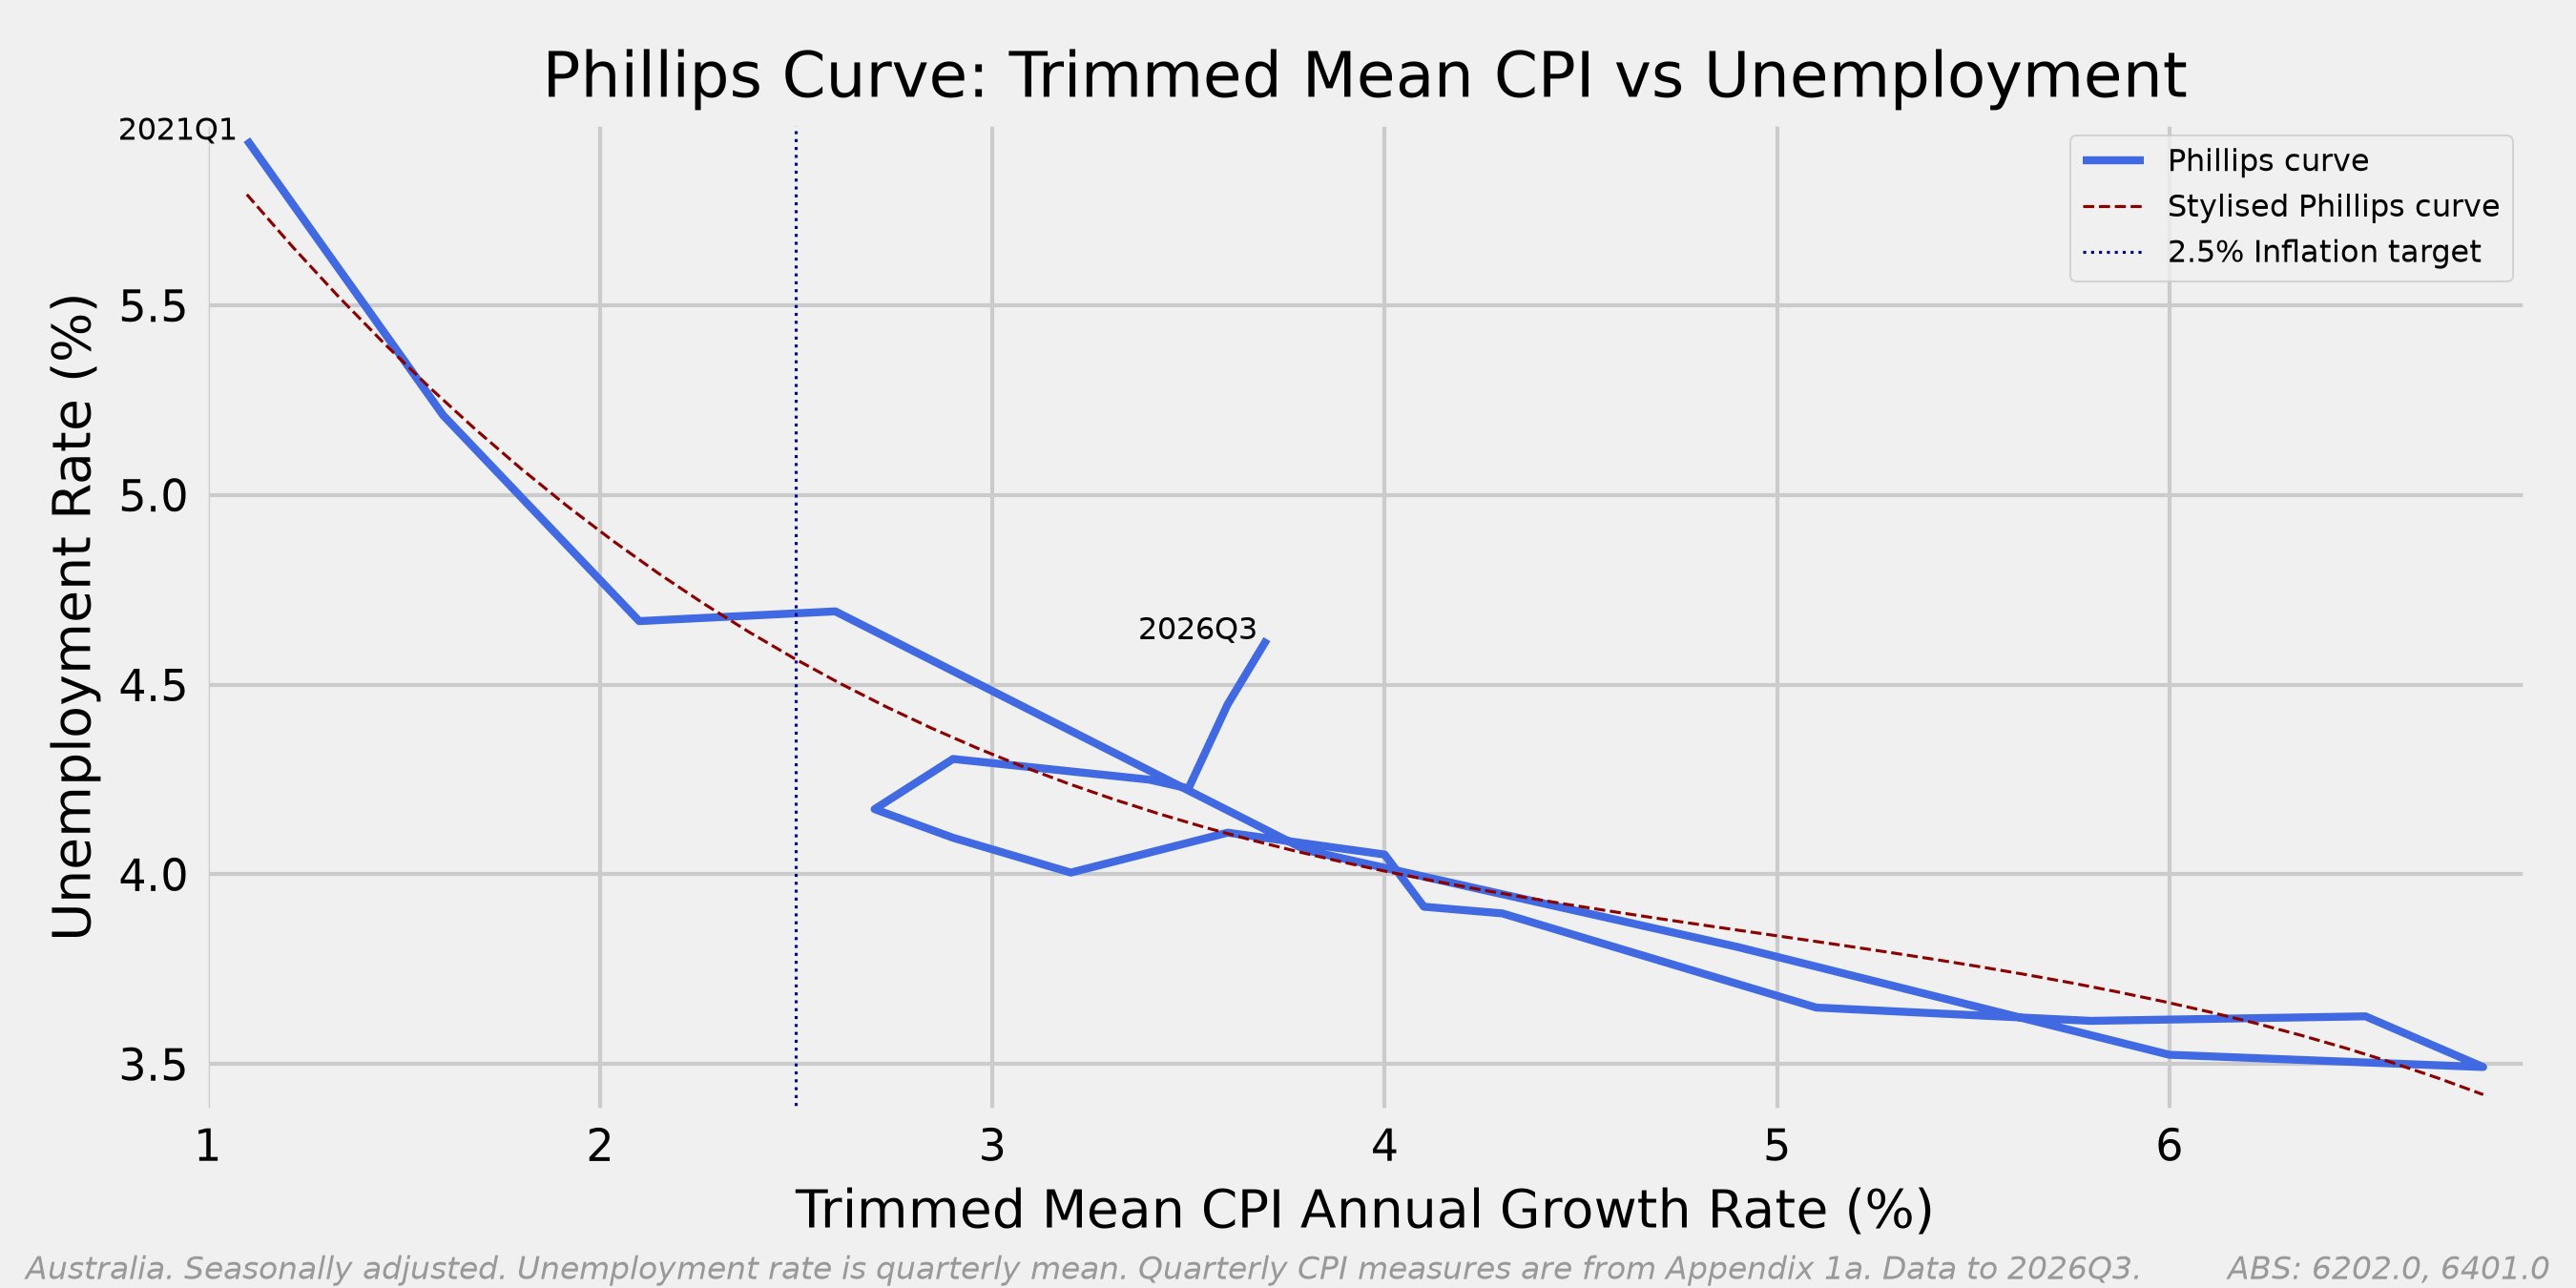
I often see people who argue that Austrlia is in stagflation. Yes there are issues at the moment. But they are nothing like the 1970s to 80s Stagflation period.



Mark 🇦🇺 retweeted

There are some signs of slowing in new dwelling price rises (its getting harder for builders to raise prices), but there are still more CPI items with inflation above 3%yoy and the trimmed mean inflation rate (which strips out big rises like petrol) seems stuck well above target.


Mark 🇦🇺 retweeted

CPI rose 4.3% in the year to September 2026
Find out more abs.gov.au/media-centre/medi…

Lowering immigration reduces both sides of the ledger (supply and demand). Reducing NDIS spending, let's see if it is achieved.