Empowering Traders, Analysts, and Portfolio Managers to discover unique market opportunities with powerful software and valuable education.

Brisbane, Australia
Joined May 2009
Optuma retweeted
US midterms. 10 days away. I went back 76 years and ran the $SPX numbers myself. 19 out of 19. Every single post-midterm period GREEN. Smallest gain: +2.23%. Largest gain: +29.51%. Not one negative return since 1950. History doesn't guarantee the next move, but you can't ignore 19 consecutive winners. 2026 is up next. $SPY $QQQ @Optuma
94
131
29
1,071
203,541
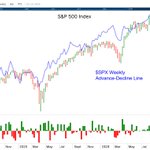
Weak daily breadth today for $SPX (net advance/decline of -231) but +157 on the week, despite a -0.5% loss. In fact, the index has closed lower the last 2 weeks with more stocks advancing.
8
1,186
$SPX is only 2.3% off its high close, but 4 of the sectors are >10%, with $XLK at 9.7% following today's 3% drop:
1
6
1,113
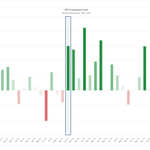
Here's the average monthly $SPX performance for the US Presidential cycle. The October of the midterm year is the 3rd best-performing month (3.0%) behind only January & April of Year 3:
1
3
934
Today ended a 53 day streak for the $SPX without a -1% fall - the longest since Jan 2020. Over that period the index gained 6.7% - mostly in the first few days of August.
1
10
1,188
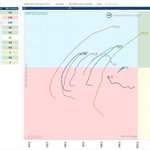
Energy $XLE is the only sector in the RRG Leading quadrant as tech $XLK weakens and heads southwest. 8 of the 9 other sectors are moving through Improving (only Communications $XLC is Lagging).
2
8
1,044
Yesterday saw the 20th ATH for $AAPL this year, and the 1st for $MSFT. Green lines on this $XLK chart show when they make a new ATH on the same day:
1
5
942
Connect Optuma to a FRED account to use any of their data. In this example, the Recession Probability for the US is 0.085%:
1
5
1,005
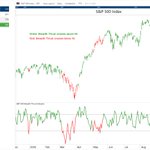
$SPX net Advance-Decline came in at +142 today. Breadth Thrust is back in the green for the first time since Aug 28th.
1
2
26
2,140
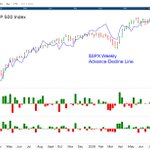
$SPX closed at a weekly ATH, and for the 1st time in 8 weeks there were more stocks closing higher on the week than declining:
Now 7 weeks with more $SPX stocks declining (330) than advancing on the week (170):
1
9
1,335
Now 7 weeks with more $SPX stocks declining (330) than advancing on the week (170):
The $SPX may have gained 1.2% on the week, but 287 stocks close lower vs 216 higher, marking the 6th straight week of negative breadth. This is the longest streak since tracking started in 2015.
1
1
1
13
2,328
AAII Sentiment Bull/Bear spread remains negative, but has narrowed to -11.9%:
9
1,126
Every day this month has seen on average of 96 more 1M lows than 1M highs in $SPX stocks (47 more 3M lows, and 11 more 12M lows)
6
1,066
The $SPX may have gained 1.2% on the week, but 287 stocks close lower vs 216 higher, marking the 6th straight week of negative breadth. This is the longest streak since tracking started in 2015.
4
2
19
3,211
$SPX breadth continues to deteriorate. On Tuesday the index was flat with 249 stocks advancing and 253 declining. Today was flat again, but there were only 176 advancing and 326 declining:
1
1
11
2,256
Optuma retweeted
Today is September 22. According to historical seasonality, we’re entering the ugliest stretch of the month. Seasonality is context, not a signal. Let’s see which way the wind blows. $SPX $SPY $QQQ @Optuma
4
13
1
111
22,980
Despite the $SPX having its best day since August 4th, there were more stocks making new lows than highs: -> 31 new 1 Month highs 130 new lows -> 13 new 3 Months highs 68 new lows -> 7 new 12 Month highs 29 new lows It's been a similar story for the last few weeks:
1
1
1
7
4,020
More breadth weakness: 10% of $SPX stocks on Wednesday had an RSI(14) below 30. On Sept 1st there were twice as many stocks below 30 than above 70:
2
966