

18+ Yr Professional Trader | Market Structure & Rotation Weekly-led signals. Defined risk. No noise. Structure over headlines. Defined risk only.
Chicago, IL
Joined August 2009
- Tweets21.1K
- Following29
- Followers32.3K
- Likes11.1K





US midterms. 10 days away.
I went back 76 years and ran the $SPX numbers myself.
19 out of 19. Every single post-midterm period GREEN.
Smallest gain: +2.23%.
Largest gain: +29.51%.
Not one negative return since 1950.
History doesn't guarantee the next move, but you can't ignore 19 consecutive winners.
2026 is up next.
$SPY $QQQ @Optuma


$SPX — THE WAVE COUNT DOES THE TALKING.
October 6: Published an alternate Expanded Flat warning of a potential reversal.
October 16: Updated the count after SPX rebounded from 7,631.77, projecting wave (ii) resistance at 7,756.84.
October 21: SPX closed at 7,757.17.
Almost to the penny.
Now, does wave (iii) take over from here?
A break above 7,814 invalidates this alternate count.
Time will tell.
Same roadmap. Let price do the talking.
$SPY $QQQ


$SPX
Now THIS is worth paying attention to.
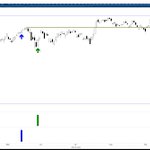
Two independent signals firing on the same Daily candle.
🟢 GREEN: The Whipsaw Pattern (Outside–Inside–Outside Day).
🔵 BLUE: Bullish Engulfing Candle.
Both appearing right at a key support level.
A bottom confirmed? Not yet.
The market is just chewing up time, waiting for earnings and the midterm election results.
No need to predict every move.
Let the price do the talking.
Meanwhile, everybody's been working overtime calling the top for months.
$SPY $QQQ @Optuma


$SPX — THE CHART DOES THE TALKING.
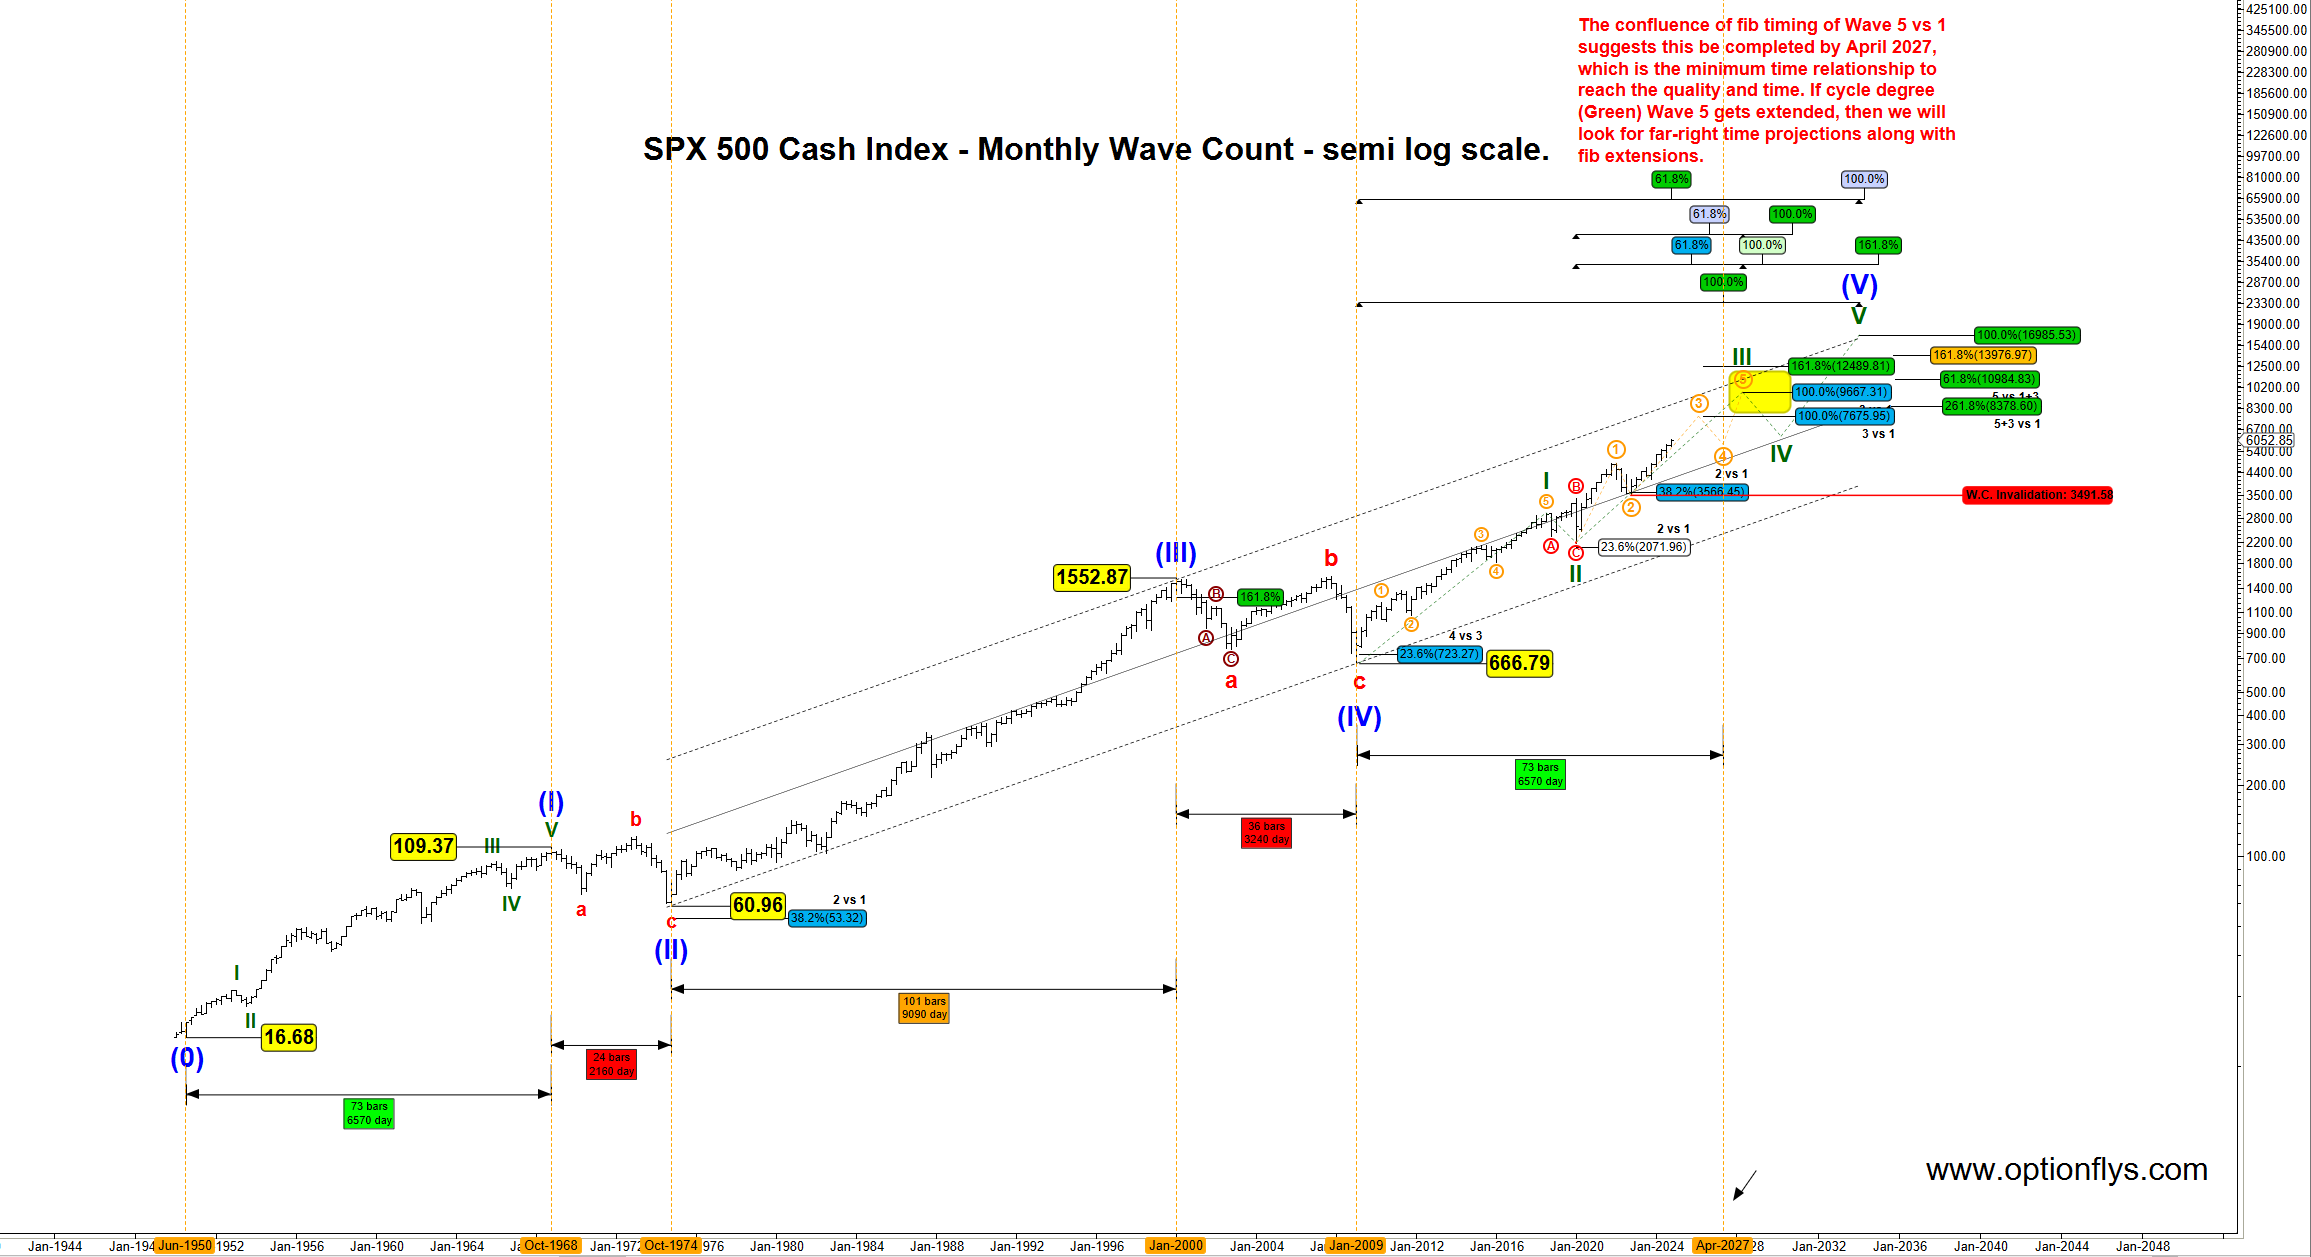
December 10, 2024. SPX was trading around 6,052 when I published my Super Cycle Degree monthly Elliott Wave count.
No hindsight. The roadmap was posted nearly two years ago.
Fast forward to October 2026.
SPX reached 7,844, and price tagged my 7,675.95 measured-move target virtually to the penny along the way.
That's nearly 1,800 points and 29.59% upside from where I published the original count.
This is why I spend years studying wave relationships, price, and Fibonacci measurements instead of chasing every headline.
I don't redraw history to fit the market. I update the count as price unfolds.
Original post attached. Updated monthly count attached.
Ignore the noise. Follow the wave count.
Now let's talk about what comes NEXT.
Dec 10, 2024 👇
xitter.cf/optionflys/status/1866…
$SPY $QQQ


$SPX
On October 6, I shared an alternate Expanded Flat count showing the risk of a reversal.
October 16. SPX rejected the 7,843 area, and here we are.
Now everyone is panicking after one rough week.
Folks, corrections are part of every bull market. They unfold through price, time, or both. Not every selloff means the bull market is over.
The Daily is flashing SELL. Respect it. Let the correction unfold and wait for confirmation.
This wave count is a roadmap, not a guarantee.
I've been through enough market cycles to know that panic rarely makes anyone money.
Control your emotions. Protect your capital. Have some patience.
The market isn't going anywhere. Opportunities will come again.
$SPY $QQQ


Something interesting on $RUT.
6 consecutive weekly lower closes.
Previous occurrences:
October 2014.
October 2018.
Now October 2026.
Weekly RSI at 11
October seasonality shows persistent selling pressure.
Let's see how much of this rate pressure is already priced in.
Three occurrences. All in October.
Coincidence? You decide.
$IWM $SPX $SPY $QQQ @Optuma

Every day on X, someone is calling for a market top or the next big crash. I guess it keeps people entertained.
Meanwhile, take a look at this SMH Elliott Wave count on a 2-week semi-log chart, going back nearly two decades.
The bigger picture tells a very different story, one that's hard to ignore.
Corrections are part of the process. They don't automatically end a bull market.
This isn't a trader's chart. It's a long-term investor's roadmap.
Let price do the talking.
$SMH $SPX $SPY $QQQ

$SPX
Two corrections, almost identical.
2024: -9.70%
2026: -9.78%
What followed?
First rally: +20.08% in 135 bars
Current rally: +24.18% in 131 bars.
Now look at those two blue structures near the highs.
Interesting similarity in both time and price.
Doesn't mean the top is in. But with shitty breadth and SPX chopping around at highs, it's worth watching.
Bears, there's your weekend homework. 😂
Price decides.
$SPY $QQQ @Optuma


Mo retweeted
$SPX
April 4, 2025 → September 2026.
It has been a while since I posted the bigger time frame wave count.
Too many traders focus on the smaller time frames and keep moving the goalposts to fit their narrative, but forget to look at the bigger picture.
The first chart was the roadmap going into the April low — to the penny.
The second chart is where the wave count stands today after the AI boom.
Elliott Wave is not about predicting every tick.
It’s about building a roadmap, defining invalidation, and adjusting as price confirms or rejects the count.
$SPY $QQQ


$SPX
October started with a simple map.
7779 above.
7508 below.
Four days later, here we are.
Price has marched straight back into 7779 and the descending trendline from the August high.
Here comes the test.
Break it, and the door opens for expansion.
Reject it, and we're still inside the range.
No prediction needed.
Price decides.
$SPY $QQQ


