

Banking sector research | Credit quality, deposits, and earnings trends across U.S. financials.
Wisconsin, USA
Joined January 2013
- Tweets28.3K
- Following683
- Followers1.2K
- Likes972




$BTC is shown near $79,941, about 2.4% below its 50-day moving average near $81,937 and above its 200-day near $73,120. The 50-day line has flattened; proximity to it alone does not establish the direction of the next move.


Cheddar Flow reports $SKHY January $130 calls up 56% and $150 calls up 73%. Applying 56% to the reported $18M premium implies $10.08M in hypothetical gains before costs; the screenshot does not establish continued ownership or realized profits.

The post's roughly 206% average combines three selected rebounds lasting about 5 years, 11 years and 21 months. These are cumulative gains over different periods; their average does not identify the next market bottom or guarantee future returns.

$SPX has rebounded toward 7,700 on the four-hour chart, recovering above the marked 7,618-7,657 zone. The snapshot shows 7,698.38, with resistance near 7,760 overhead. The current candle is still forming, so a breakout remains unconfirmed.

$USO's historical seasonal average weakens in the highlighted Nov. 6-Dec. 10 window. The lower panel tracks $1 invested only during the selected seasonal window each year. This pattern alone does not confirm a reversal.

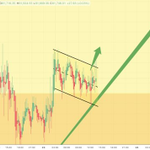
$BTC is consolidating near $81.75K inside a descending channel on the 15-minute chart after a rebound. Price remains below the upper boundary, so a breakout is not yet confirmed. The $87K target is the author's projection.


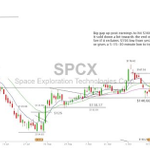
$SPCX's post-earnings jump reached roughly $166 before pulling back in this daily chart. The highlighted gap zone lies below the displayed price, making the response to that area a key reference for the next move.

$USDJPY is showing tight compression on the daily chart. Recent candles are clustering together as the surrounding bands narrow and flatten. A sustained break from this range would help clarify the next directional move.

$META options price a ±6.8% move through Friday in this snapshot. The average absolute next-day earnings move in SpotGamma's sample was 8.2%, with 7 of the last 12 reactions exceeding 6.8%, including all of the last five.

$QQQ's $736 calls expiring Oct. 26 are near $2.72 in this snapshot, close to the session high of $2.74. Volume stands at 6,525 contracts versus reported open interest of 308, though turnover alone does not identify new long positions.

$PEP's rebound from the October lows is nearing the 100-day moving average, with roughly $136 highlighted as the next test. Holding above that area would strengthen the recovery; the 200-day average remains higher overhead.

$V has broken out of its base and followed through with a strong rally above its rising moving averages. The former resistance band is the area to watch on a pullback, where a successful retest would reinforce the breakout.

$SOL is near $106.50 in this snapshot as attention turns to Alpenglow's mainnet rollout. Price remains between $105 support and $108.30 resistance. A sustained break above $108.30 would provide the next technical sign that the rebound is extending.

A sharp intraday spike toward 2,498 has reversed to about 2,471 in this snapshot, giving back most of the move. Price is back near its earlier trading range, where the next reaction will help show whether buyers can regain ground.

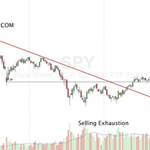
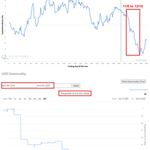
$VXX short-sale volume spikes coincide with several local S&P 500 lows in this chart, but there are misses too. The measure tracks daily short sales, not outstanding short positions, so the pattern alone doesn't establish a reliable bottom signal.


$SPCX is at $147.09 in this snapshot, up 18.63% over the displayed three months. That puts it above SpaceX’s $135 IPO price and just below its $150 opening trade. The starting point makes a big difference when judging the move.
