
Knowledge from data for everyone. Founder, @dataforin. Book: "Whole Numbers & Half Truths" (Westland '21).
- Tweets25.6K
- Following1.8K
- Followers69.4K
- Likes12.2K




ALT Title: Share of people who smoke/use tobacco by age-group (2021) Sub-title: Tobacco usage in India is highest among older people Explanation: Tobacco use rises with age, from 5% among teenagers and 16% among people in their 20s to 26% in their 30s, 31% in their 40s, and 33% among people over 50. Source: National Family Health Survey; International Institute for Population Sciences Attribution: Data For India | CC BY

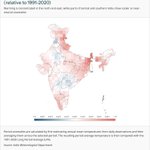
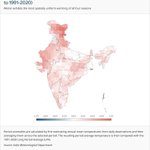
ALT Title: Winters in India are warming the most uniformly of all four seasons Sub-title: Mean winter temperature anomalies, 2015–2025, relative to 1991–2020 Explanation: Winter shows warming across nearly all of India. The strongest increases are in the northwest, locally approaching 1.1°C, while central and southern areas generally show smaller increases of about 0.2°C to 0.5°C. Source: India Meteorological Department Attribution: Data For India | CC BY


ALT Title: Large families are becoming increasingly uncommon in India Sub-title: Share of mothers by the number of children they have, over time Explanation: The share of mothers with five or more children fell from 27% in 1993 to 8% in 2021, while the share with two children rose from 21% to 39%. Over the same period, the share with one child increased from 17% to 21%, the share with three children rose slightly from 20% to 22%, and the share with four children declined from 15% to 10%. The data excludes women with no children and includes sampled women ages 15–49. Source: National Family Health Survey, International Institute for Population Sciences Attribution: Data For India | CC BY

ALT Title: The female advantage in life expectancy in India appeared only in the 1980s Sub-title: Life expectancy at birth in India by gender, 1950–2024 Explanation: Life expectancy rose substantially for both women and men, from about 41 years in 1950 to 74 years for women and 71 years for men in 2024. Men had a slightly higher life expectancy until the early 1980s, when women overtook them. The female advantage then widened, reaching more than three years by 2024. Both groups experienced a sharp temporary decline around the COVID-19 pandemic. Source: World Population Prospects, United Nations Population Division Attribution: Data For India | CC BY


ALT Title: The less educated are more likely to be self-employed in India Sub-title: Type of employment, by education level (2024) Explanation: Self-employment becomes less common as education levels rise, falling from 66% among illiterate workers to 40% among workers with higher education. Salaried work shows the opposite pattern, rising from about 7% among illiterate workers to 58% among those with higher education. Casual work also declines sharply, from 28% to about 2%. Source: Periodic Labour Force Survey, National Statistics Office Attribution: Data For India | CC BY

ALT Title: The share of women in the labour force is more than twice as high in Viet Nam as in India, yet fertility rates are similar Sub-title: Fertility rate and female labour force participation, by country (2022) Explanation: In 2022, 76% of women in Viet Nam were in the labour force, compared with 32% in India. Despite this large difference, both countries had a total fertility rate of about 1.9 children per woman. Source: World Development Indicators, World Bank Attribution: Data For India | CC BY

ALT Title: Internet usage by age (2025) Sub-title: More pre-teens in India have used the internet than people in their 40s Explanation: Internet use rises sharply with age among children, from 8% of those aged 0–4 to 54% of those aged 5–9 and 81% of those aged 10–14. It peaks at 94% among both 15–19- and 20–29-year-olds, then falls steadily with age: 85% for ages 30–39, 65% for 40–49, 43% for 50–59, and 23% for people aged 60 and above. Source: Comprehensive Modular Survey - Telecom, National Statistics Office Attribution: Data For India | CC BY

ALT Title: Infant deaths are falling in India, but are increasingly concentrated in the first month after birth Sub-title: Neonatal and post-neonatal infant mortality per 1,000 live births, over time Explanation: A stacked area chart shows that India’s infant mortality rate has declined sharply since 1981. Neonatal mortality, or deaths in the first month after birth, has fallen more slowly than post-neonatal mortality. As a result, infant deaths are now increasingly concentrated in the first month after birth. Source: Annual Statistical Reports, Sample Registration System Attribution: Data For India | CC BY

ALT Title: Wages of salaried workers by years spent in education (2024) Sub-title: A higher education is associated with a significant wage premium in India Explanation: Wages are relatively flat for workers with zero to eight years of education, mostly staying below ₹13,000. They begin to rise more clearly after around 10 years of education, reaching about ₹17,500 for workers with 11 to 12 years of education. Wages increase further for workers with higher education, rising to about ₹22,000 to ₹26,500 for those with 13 to 15 years of education, and nearly ₹40,000 for those with 16 or more years of education. Source: Periodic Labour Force Survey, National Statistics Office Attribution: Data For India | CC BY

ALT Title: Only half of all Indian adults can send messages, and a quarter can send emails Sub-title: ICT skills among Indian adults aged 15+ (2023) Explanation: Horizontal bar chart showing the share of Indian adults aged 15 and above who reported having different ICT skills in the preceding three months. Sending messages (includes email) is the most common skill, reported by 53% of adults. Sending emails is much lower, at 26%. Around one in five adults can download and install software (23%), transfer files between devices (19%), or connect and install devices (17%). More advanced skills are rarer: 9% can use formulae in spreadsheets, about 6% can create presentations, and about 1% can write programs or code. Source: Comprehensive Annual Modular Survey, National Statistics Office Attribution: Data For India | CC BY

ALT Title: Life expectancy at birth Sub-title: The gap in life expectancy between India and the UK has halved since Independence Explanation: A line chart compares life expectancy at birth in India and the United Kingdom from 1950 to 2024. In 1950, life expectancy was about 41 years in India and 69 years in the UK. Both countries improved over time, but India’s gains were much steeper, rising to about 72 years by 2024. The UK rose more gradually to about 81 years. The gap between the two countries narrowed from nearly three decades in 1950 to less than a decade in 2024. India shows a sharp temporary drop around the COVID-19 pandemic before recovering. Source: World Population Prospects, United Nations Population Division Attribution: Data For India | CC BY

ALT Title: Service sectors are more likely to have formal jobs in India Sub-title: Formal and informal jobs by industry (2024) Explanation: Construction, trade and hotels, and manufacturing have the largest informal workforces, with 72 million, 71 million, and 57 million informal workers respectively. Manufacturing also has 13 million formal workers. Health and education has a more balanced split, with 14 million formal workers and 13 million informal workers. Service sectors such as information and communication, public administration, and financial services have smaller total workforces but a higher share of formal employment. Source: Periodic Labour Force Survey, National Statistics Office; Population Projections, Registrar General and Census Commissioner of India Attribution: Data For India | CC BY

ALT Title: Type of tobacco consumed by men who use tobacco (2021) Sub-title: Most tobacco consumption in India is of gutkha, not cigarettes Explanation: The chart compares the type of tobacco consumed by urban and rural men in India who use tobacco. Gutkha or paan masala is the most common form in both groups, at 37%. Cigarettes are more common among urban men, while khaini and bidi are more common among rural men. Note: Khaini is a mixture of tobacco leaves and slaked lime. Source: National Family Health Survey, International Institute For Population Sciences Attribution: Data For India | CC BY

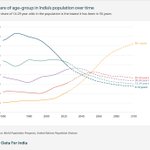
ALT Title: India’s demographic window is closing Sub-title: Share in total population by age group, over time Explanation: Line chart showing the changing share of India’s population in three age groups from 1950 to 2100. The share of working-age people, aged 15-59, rises from 57 in 1950 to a projected peak of about 65% around 2030, before declining to about 50% by 2100. The share of children aged 0-14 falls from around 40% in the 1950s to a projected 14% by 2100. The share of people aged 60 and above rises from about 5% in 1950 to a projected 36% by 2100. Data after 2024 are projections. Source: World Population Prospects, United Nations Population Division Attribution: Data For India | CC BY