

Systematic trader. Not a coder. Not a quant. Just a guy who built a machine. Full-time. Real money. Documenting the process
Florida, USA 🌴
Joined August 2022
- Tweets5.3K
- Following149
- Followers509
- Likes25.8K



Pinned Tweet
In 2023 I got laid off after 20 years in corporate.
I was stuck with a family to support.
Instead of updating my resume, I went all in on trading.
Here's my story 🧵
My intraday strategies that go both long and short really earned their keep in my book today. Instead of having what could have been a horrendous day, I ended up with what I would consider a "normal" down day overall. Still not fun, but this is exactly why I stack uncorrelated strategies.

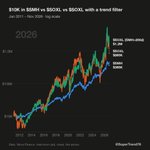
Buy and hold $SOXL had a -90% drawdown in 2022. The filter avoided most of that.
However, this time it didn't. SMH stayed above its 200-day for most of the drop, so the filtered version just went through a -77% drawdown too.
Using a regime filter isn't always the best choice. In my view position size is.

Everyone's calling the post-midterm rally "guaranteed."
I tested it on $SPY, one year after every midterm since 1950:
19 for 19 higher.
Avg +14.6% vs +9.4% for any random day.
Worst: 1986, +1.9%.
Great odds, but it's 19 data points only, so take it with a grain of salt.

Everyone also hates it when guys conflate systematic trading with quant trading

Everyone hates it when I point out that
- systematic trading is hard
- you can’t prompt your way to a profitable strategy unless you already know what you’re doing
- most people capable of making a success of it for their own account would do much better getting a job at a good trading firm instead
But this is literally the highest value thing I do in this site. Every person who takes my advice is hundreds of hours and tens of thousands of dollars saved!
Love O’Neil’s framework and these are great books, but only if you can get past the survivorship bias

For newer traders, if you haven't read the William O'Neil book or Minervini books you are doing yourself a disservice. Especially when it comes to price action and earnings.
If you are confused by the price action... "The news is so bullish, so many analyst and fundamentalists are pounding the table about how great the earnings are"
Be aware that the stocks TOP at peak earnings/right around peak earnings. You usually don't see the weakness/slowdown until multiple months, sometimes 6+ months later.
Well that wraps up what I am calling red October. Strategies lost about -9% for the month, bringing the total book back down to +6.5% since I started tracking in August. Most strategies are flat or have small positions, so mainly sitting in cash now. Lets see what November and the rest of the year brings!

The dip last week hit both my momentum and mean reversion strategies, but instead of panicking and pour through backtests to understand wether or not this was "normal" behavior for my book. I turned to a tool I created that pulls all of that data into a dashboard. Its a great way to monitor your strategies while managing your expectations. I highly recommend if you trade multiple systems.


For data use massive.com API. If you want data and a backtesting engine use quantconnect.com and plugin their MCP to whichever LLM you want


September is in the books, so I think its a good time to finally get back to my portfolio updates. I recently launched a new tracking tool that's directly connected to my broker API to make things more seamless. I have a couple of strategies imported into the tool so far and will continue to add the rest of them once testing is completed. Anyway, here are performance metrics on 2 of my strategies since late August. More to come!


SuperTrend retweeted

IBD50 ETF ("growth" stocks) vs. QQQ - are there people outside still doing CANSLIM type of trading?

The power in running multiple trading systems isn’t in the systems themselves. It comes from the portfolio construction and the correlations between them.
The chart below combines large cap momentum + mean reversion + small/micro-cap value, sharing one pool of capital. Individually they are unremarkable, but together, they produce solid combined performance.

To illustrate how wild its been for momentum and growth stocks in particular this year, I ran a backtest using the @Deepvue leaders screen.
The model uses a simple rotation of the top 10 stocks ranked by RS and rebalanced each week. They are equally weighted with a top 20 hold rule. A 200 SMA regime filter on $QQQ is used as the gate.
Return: -0.02%
Max DD: -51%
Sharpe: 0.195
A complete round trip. Lets hope the rest of the year isn't as rough.
Some of the names with the highest amount of turnover: $SNDK $AXTI $AEHR $RXT $CIEN

This is why I see so many struggling on my feed. Traders need to pay attention to which factors are in play


You don't need complex ML to beat the index. Just two clocks and a strict no trim rule on a simple rotational strategy.
$QQQ rotation:
- Dual books (Weekly/Monthly)
- Rank 6-mo momentum, hold top 5
- Exit on top 10 drop or 100d/200d MA break
- No trims
25% CAGR, 29% max DD (2013-26). The entire edge is in letting the winners run.
