

The newsletter with no news, just charts.
New York, NY
Joined September 2017
- Tweets7.5K
- Following1.1K
- Followers41K
- Likes9.2K





Today's Chart of the Day was shared by @Bluekurtic
The Semiconductor ETF recorded a massive $5.4 billion inflow last week, the largest weekly inflow on record.
Get the full details in today's report plus more great charts.⬇️
thechartreport.com/10-26-26


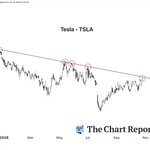
$TSLA is on pace for its best day in months, rallying right into the downtrend line from its all-time highs.

The Chart Report retweeted
The 50% retracement level has been strong support for the Nasdaq.
Will it hold again? $QQQ

Neoclouds closed at new 52-week lows on Friday, and the group is gapping lower to start the week following bearish weekend comments from Elon Musk.
The price action, however, was already sounding the alarm well before his remarks.
Read the full note in today's Morning Print. 🌤️
thechartreport.com/TheMornin…

Today's Chart of the Day was shared by @Axis_Balance
Silver is nearing a retest of its 45-year cup & handle breakout, bringing a major long-term level back into focus.
Get the full details in today's report plus more great charts. ⬇️
thechartreport.com/10-23-26

New record highs for the largest component of the Energy sector. $XOM ⛽️

The 50% retracement level has been strong support for the Nasdaq.
Will it hold again? $QQQ

Consumer Staples are breaking out on both an absolute & relative basis.
Outperformance from this group typically coincides with a market under pressure, and that’s exactly what played out yesterday.
Read the full note in today's Morning Print. 🌤️
thechartreport.com/TheMornin…

The Chart Report retweeted
Today's Chart of the Day was shared by @bluechipdaily
The AI trade beyond semiconductors continues to deteriorate, with several industrial & power names completing bearish tops.
Get the full details in today's report plus more great charts. ⬇️
thechartreport.com/10-22-26

Today's Chart of the Day was shared by @bluechipdaily
The AI trade beyond semiconductors continues to deteriorate, with several industrial & power names completing bearish tops.
Get the full details in today's report plus more great charts. ⬇️
thechartreport.com/10-22-26

The Chart Report retweeted

Everybody go give @TheDonInvesting a follow 🔥🔥

📊 "The 200-day moving average is super simple to throw up. Just gives you a trend filter."
@TheDonInvesting starts with the long-term trend, using the 200-day moving average to assess whether an asset is moving higher or losing momentum and Bollinger Bandwidth when trading to catch fast moves.
The Chart Report retweeted

Honored to be featured as Chart of the Day by @TheChartReport!

Today's Chart of the Day was shared by @CalebFranzen
The $80k polarity level continues to hold as support for Bitcoin, giving those seeking crypto exposure a well-defined area to manage risk against just ahead of what has historically been Bitcoin’s best month of the year.
Get the full details in today's report plus more great charts. ⬇️
thechartreport.com/10-21-202…

The Chart Report retweeted
Today's Chart of the Day was shared by @CalebFranzen
The $80k polarity level continues to hold as support for Bitcoin, giving those seeking crypto exposure a well-defined area to manage risk against just ahead of what has historically been Bitcoin’s best month of the year.
Get the full details in today's report plus more great charts. ⬇️
thechartreport.com/10-21-202…
The Chart Report retweeted
The market environment today is very different from the one we experienced in Q2.
When the Nasdaq 100 broke out above $635 in April, the market ripped higher.
This time, when QQQ tried to clear $745, the breakout quickly failed.
Read the full note in today's Morning Print. 🌤️
thechartreport.com/TheMornin…

The Chart Report retweeted

¿Biotecnológicas preparando un impulso?

The Chart Report retweeted

Appreciate being included in tonight's @TheChartReport. The Indices don't seem to be paying much attention to the chart however.

$SPX I posted this 10/6/26 suggesting we might be close to a bottom. Here it is updated. Breadth per the % stocks on P&F buy signals continues to improve. So far this says to consider taking more risk. We still need more confirmation.

Today's Chart of the Day was shared by @CalebFranzen
The $80k polarity level continues to hold as support for Bitcoin, giving those seeking crypto exposure a well-defined area to manage risk against just ahead of what has historically been Bitcoin’s best month of the year.
Get the full details in today's report plus more great charts. ⬇️
thechartreport.com/10-21-202…