

Breakout trader, chart nerd and lifelong Rangers fan. Charts, setups and the occasional Blueshirts rant. No hype. Not advice.
Missouri, USA
Joined October 2026
- Tweets1K
- Following144
- Followers133
- Likes84
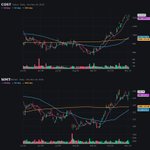
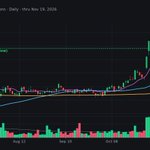


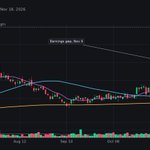

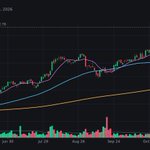


$MANH closed down less than 1% today while the Nasdaq lost about 5%. I'll take boring.
Quick intro: they make the warehouse and supply chain software a lot of big retailers run on. Black Friday is next week, so their customers are heading into the busiest stretch of the year.
The chart: more than doubled off the April low, topped near 263 on Nov 4, and has drifted back about 8% since. It did close near the low of the day, so not a free pass.
Does quiet strength like this get your attention more than the bounce candidates?
21
This week's Top Shelf Circle.
@AboundWealth
@HandOfCompound
@BenTradesData
@AdrianCInvests
@worstgeneD
Follow and promote these five. Good people to have in your feed.
1
24
🩸 Bloody market out there lately!
Looking to connect with more traders! Drop a follow, say hello, and I’ll follow back! 🤝
Whether you’re trading breakouts, hunting growth stocks, or just trying to survive this market, let’s connect!
Share your favorite ticker, charts, setups, wins, and losses.
Let’s build a solid trading community and survive the red days together! 🚀
$SPY $QQQ $IWM
1
2
46

4 chart rules for weeks like this:
A breakout into a falling market usually needs a second try.
Stocks still near highs while the Nasdaq drops are your next list.
Heavy volume on a red day matters more than a light green bounce.
Nobody ever missed a base by waiting a week.
24
Oversold can stay oversold longer than my patience can.
I'm not trying to catch the low. I'm watching which stocks bounce first and hardest when it finally turns. That list usually tells you who leads next.

Look at what's happening beneath the surface:
$QQQ just tagged 634.
NYMO is deeply oversold.
Daily RSI showing bullish divergence.
$VIX reached my first buy zone around 30.
S&P 500 is stretched 3.3 standard deviations from its 50-day SMA.
We're seeing multiple signs of selling exhaustion showing up at the same time.
Does this guarantee the bottom is in? NO. We could still see another flush lower. But when this many oversold signals start lining up, the potential for a violent snapback becomes very real.
BIG BOUNCE POTENTIAL HERE. ✌️
35
Anything green on a morning like this goes straight on my list.
$CBRS is still a long way under its fall highs though, so I'm filing it under "interesting" too. I want to see it hold up into the close before it means much.


1
154
$DFIN has been stuck between about 64 and 72 for two weeks. In this tape, stuck is a compliment.
Quick intro: they make the software companies use to prep and file their SEC documents. Not exciting. Every public company needs it anyway.
The chart: a run from about 48 to 72 in October, then a tight pause on mostly lighter volume. Sellers haven't shown up in size yet.
The level I'm watching is 64.15, the Nov 6 low. Hold it and this is a rest. Lose it and the pause is over.
I'll check back on it next week either way.

1
21
$DFIN closed at 70.06 on Monday. Three days later it's 65.43.
Quick intro if you've never heard of it: they run the software a lot of public companies use to file their reports with the SEC. Not exciting, which I kind of like.
The 50-day is still way down near 55, so the bigger trend hasn't changed. And on a day QQQ dropped about 2%, it was just one more red name.
Normal breather after a big run, or the start of something deeper? How do you tell the difference?
1
25

Turnarounds have fooled me more than any other setup. The first bounce off the lows always feels like the move. Most of the time it's just the first rally inside a long base.

$ALOY A potential turnaround can look convincing on a chart. The real test is whether price can sustain the move.
I’m watching for a proper base, tighter price action, stronger relative strength and rising volume as the stock clears resistance.
The Elliott Wave structure offers one possible scenario, but the market has the final say.
I’d rather enter after confirmation than commit capital to an attractive prediction.
Watch the price. Respect the risk. Let the evidence lead.
Disclaimer
thetitanmedia.com/disclaimer


3
24
Biggest IPO ever and I'll be refreshing the first print like everyone else. The chart I actually care about is the one a month from now. New issues usually need time to build a base before they tell you much.

WOW. $ANT is already up 25% from its $83 IPO price and it hasn't opened on Nasdaq yet.
The $ANT perp on Hyperliquid is trading around $104.
OVER 400 Anthropic employees are set to be worth more than $100 MILLION each after today.
The AVERAGE employee could be worth over $40M

2
34
$VCEL grows new knee cartilage from your own cells. The stock has been stuck under one number for 6 days.
Most people have never heard of Vericel.
Doctors take a small cell sample, the company grows it in a lab, and it goes back into the knee. They also make skin grafts for severe burns.
Last quarter revenue grew 26% and they raised guidance for the third straight time.
The stock gapped up on Nov 5 and ran to 59.75. Since then it's gone sideways, sitting within about 2% of that high on lighter volume than the run up, while the S&P slipped under its 200 day.
That line is the whole chart. A push through 59.75 on real volume says buyers are still in charge. A slide back into the gap says the news got priced in.
I'll check back on it next week either way.

29
$TENB ran almost 16% today and closed near the high.
Tenable sells software that finds the weak spots in a company's systems before hackers do. Not flashy, but every company needs it.
It opened at the low of the day and never really looked back. Volume came in above its recent average too.
The whole cyber group moved before Palo Alto even reported. Then $PANW beat after the close.
Still well under its late October high, so this has to prove it can hold.
Would you trust a group move like this, or wait to see tomorrow?
1
68
$SN is up about 4% today, a few bucks under its Nov 9 high near 232.76.
Full disclosure, I own it, so I'm biased.
Does it take out that high before Thanksgiving?

1
48
Monster quarter, and the stock still went red by the open.
Lesson I keep relearning the hard way: the report tells you about the company. The reaction tells you about the crowd.

2
24
$FIGS sells scrubs to nurses and doctors. The stock is up about 128% in a year.
Mostly online, sold straight to the people wearing them. Boring business. The chart is a lot more fun.
The line on my screen is 23.76, last week's high. Since then it's drifted back about 12% on lighter volume than the run up.
Lighter volume on a pullback usually means sellers aren't in a hurry. Usually.
If it gets back through 23.76, the base did its job. If it doesn't, I'll tell you.

2
2
70
$EXEL closed up almost 2% today, right at the high of the day.
The Nasdaq was red and the S&P hit its lowest close since July. Didn't seem to matter here.
It opened near the low and finished at the high. Hard to draw a cleaner day than that.
Still about 7% under the early November high, so there's work left.
Closing at the high on a day like this is worth remembering when the market turns. What would you want to see from it next?
1
49